
Page 78 -
P. 78
3.4 Dimensional Reduction 65
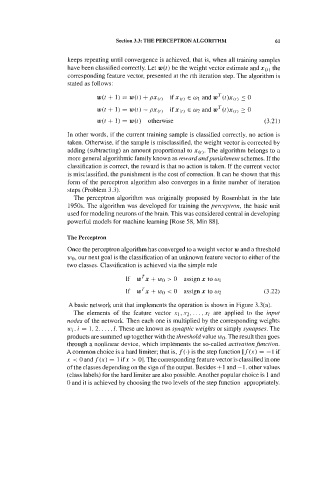
Figure 3.11. Scatter plots for the first two classes of cork stoppers. (a) Supervised
classification; (b) Clusters with Ward's method.
3.4 Dimensional Reduction
In the previous sections several examples of data clustering using two features
were presented. Utility and interpretation considerations could then be easily aided
through visual inspection of the scatter plots of the features. The situation is not so
easy when more than two features have to be considered. Visual inspection is
straightforward in two-dimensional plots (scatter plots). 3-D plots are more
difficult to interpret, therefore they are much less popular. Higher dimensional
spaces cannot be visually inspected. In the present section we will approach the
topic of obtaining data representations with a smaller number of dimensions than
the original one, still retaining comparable inter-distance properties.
A popular method of obtaining two or three-dimensional representations of the
data is based on the principal component analysis presented in section 2.4. Let us
consider again the eigenvectors of the cork stoppers data (c=2) mentioned in
section 2.4 and let us retain the first two principal components or factors'. The
coefficients needed for the transformation in a two-dimensional space with new
features (factors) Factor1 and Factor2, as a linear combination of the original
features are shown in Figure 3.12a. The representation of the patterns in this new
space is shown in Figure 3.12b.
The relation between the factors and the original features can be appreciated
through the respective correlation values, also called factor loadings, shown in
Figure 3.13a. Significant values appear in black. A plot of the factor loadings is
I
Principal components analysis is also sometimes called factor analysis, although in a strict
sense factor analysis takes into account variance contributions shared by the features. In
practice the difference is usually minimal.