Page 79 -
P. 79

66      3 Data Clusterinrr


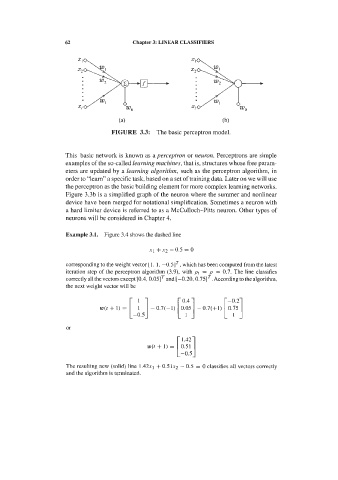
                               shown in Figure 3.13b. It is clearly visible that Factor1 is highly correlated with all
                               features  except  N  and  the  opposite  happens  with  Factor2.  These  observations
                               suggest, therefore, that the cork stoppers classification can be achieved either with
                               these two factors or with feature N and one of the other features.


                                 FACTOR   Principal
                                 ANALYSIS  components

                                            121 ]  -.  242
                                 N          090  -.576
                                 PRT        .I13  -.383
                                 ARM        ,106   .296
                                 PRM        ,108   .246
                                 ARTG       ,123   .065
                                 NG         ,123  -.OD9
                                 PRTG       .I26   .037
                                 RAAR       .I10   .241
                                 RAN        116    246


                               Figure 3.12.  Dimensionality reduction  of  the  first  two  classes of  cork  stoppers
                               using two eigenvectors. (a) Eigenvector coefficients; (b) Eigenvector scatter plot.


                                                               0.6
                                                               04.           ARM
                                                                               tR.M  R:N
                                                               02.              RAAR
                                                                                        AR:G   PRTG
                                                             ..                        NG
                                                             rn  0.0
                                                             9
                                                             p  -0.2
                                                                                       ART
                                                                                        0
                                                              -0  4
                                                                                  P!T
                                                              06
                                                                   N
                                                              -0.8
                                                               066   0.72   0.78   0.84   0.90   0.96   '
                                                           b                  Factor 1
                               Figure 3.13. Factor loadings table (a) and graph (b) for the first two classes of cork
                               stoppers.


                                 Notice  that  the  scatter plot  of  Figure 3.12b is in  fact  similar to the one  that
                               would  be  obtained  if  the  data of  Figure  3.11a  were  referred  to  the  orthogonal
                               system of the factors.
   74   75   76   77   78   79   80   81   82   83   84