
Page 81 -
P. 81
68 3 Data Clustering
Data Similarity
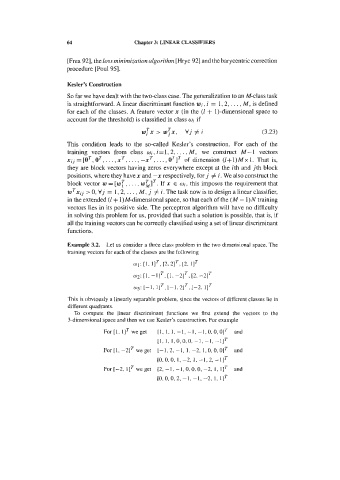
Figure 3.15. Shepard diagram for the Food dataset, showing the target distance d'
(dots) and the transformed distance Ad) (step function) against the original data
similarity.
We illustrate the application of this technique using the Food dataset. In order to
have comparable features in terms of their contribution to the dissimilarity
measure, the following standardized features were computed: Call0 = Calllo; P10
= P110; CalO = Ca/lO; B10 = BlB2xlO.
When using Statistics for multidimensional scaling, the first step is the creation
of a dissimilarity matrix for all patterns, which can be done during the cluster
analysis process. The elements of the dissimilarity matrix are the distances d(x,, x,).
Figure 3.14 shows this matrix using Euclidian distances. For notation simplicity,
food cases have been named from A to Z and then from AA to AJ.
Next, the iterative multidimensional scaling is performed on this matrix, after
setting the desired number of dimensions (d=2 for this example). After
convergence of the iterative process the user has the option to evaluate the
goodness of fit of the solution by looking at the Shepard diagram shown in Figure
3.15. This diagram shows the target distances d0(xi, xi) and the transformed
distances Jd(xi, xi)) against the original ones. The transformed distances are
represented by a step-line. As Figure 3.15 shows the target distances are very close
to the step-function, indicating a good fit to the monotone transformation.
Figure 3.16 shows the Food data represented in the two derived dimensions with
a four cluster solution. When tree clustering is performed with the Ward method
and a Euclidian metric, the solution shown by the vertical icicle of Figure 3.17 is
obtained, which shows a good agreement with the scatter plot in the reduced two-
dimensional space.
The interpretation of the clusters can be a problem when using multidimensional
scaling alone. With principal components analysis we can derive two factors