
Page 143 - Percolation Models for Transport in Porous Media With
P. 143
7.3 EXPERIMENTAL DATA PROCESSING 137
y!
I
10
5
D '--''----'-----L-2.1-:11,..-1;."'
Figure 51: Histogram of the fracture trace concentration on the core surface
1,5.___...._ _ _._ _ _,
1,Q U 2,1/ ~ds>,CM
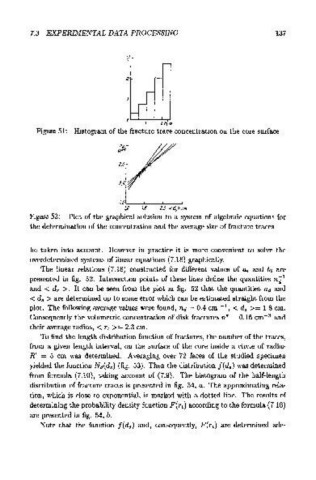
Figure 52: Plot of the graphical solution to a system of algebraic equations for
the determination of the concentration and the average size of fracture traces
be taken into account. However in practice it is more convenient to solve the
overdetermined systems of linear equations (7.18} graphically.
The linear relations (7.18} constructed for different values of ai and bi are
presented in fig. 52. Intersection points of these lines define the quantities n;t 1
and < d. >. It can be seen from the plot in fig. 52 that the quantities na and
< d. > are determined up to some error which can be estimated straight from the
plot. The following average values were found, na = 0.4 em -t, < d 8 >= 1.8 em.
Consequently the volumetric concentration of disk fractures n• = 0.16 cm- 3 and
their average radius, < Tt >= 2.3 em.
To find the length distribution function of fractures, the number of the traces,
from a given length interval, on the surface of the core inside a circle of radius
R' = 5 em was determined. Averaging over 72 faces of the studied specimen
yielded the function Na(ds) (fig. 53}. Then the distribution f(d 8 ) was determined
from formula (7.10}, taking account of (7.9}. The histogram of the half-length
distribution of fracture traces is presented in fig. 54, a. The approximating rela-
tion, which is close to exponential, is marked with a dotted line. The results of
determining the probability density function F(rt) according to the formula (7.16)
are presented in fig. 54, b.
Note that the function f(d 8 ) and, consequently, F(rt) are determined ade-