
Page 144 - Percolation Models for Transport in Porous Media With
P. 144
138 CHAPTER 7. PARAMETERS OF FRACTURED ROCKS
I I
i\-
\
\
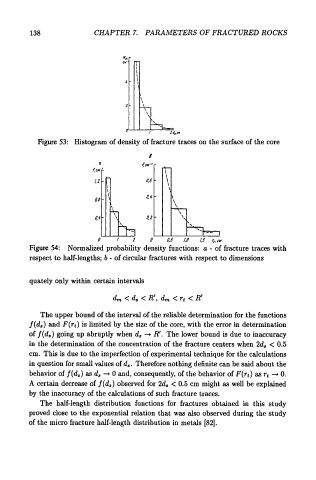
Figure 53: Histogram of density of fracture traces on the surface of the core
I
a F,ur·r
f.CM·'
1,2 D.5
I
I
I 0,4
0,1
0,4 0.2
0 I 2 0 OJ 1,0 1,5 fi,CM
Figure 54: Normalized probability density functions: a - of fracture traces with
respect to half-lengths; b - of circular fractures with respect to dimensions
quately only within certain intervals
dm < ds < R', dm < Tt < R'
The upper bound of the interval of the reliable determination for the functions
f(ds) and F(rt) is limited by the size of the core, with the error in determination
of f(ds) going up abruptly when ds --+ R'. The lower bound is due to inaccuracy
in the determination of the concentration of the fracture centers when 2d 8 < 0.5
em. This is due to the imperfection of experimental technique for the calculations
in question for small values of d 8 • Therefore nothing definite can be said about the
behavior of f(ds) as d8 --+ 0 and, consequently, of the behavior of F(rt) as rt --+ 0.
A certain decrease of f(ds) observed for 2d8 < 0.5 em might as well be explained
by the inaccuracy of the calculations of such fracture traces.
The half-length distribution functions for fractures obtained in this study
proved close to the exponential relation that was also observed during the study
of the micro fracture half-length distribution in metals [82].