
Page 104 - Performance Leadership
P. 104
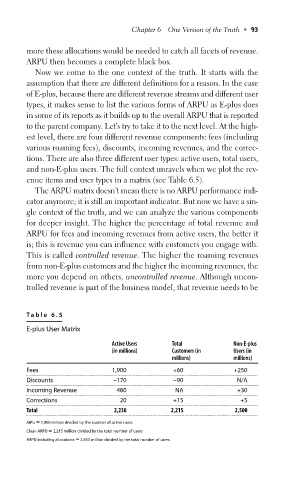
Chapter 6 One Version of the Truth • 93


            more these allocations would be needed to catch all facets of revenue.
            ARPU then becomes a complete black box.
              Now we come to the one context of the truth. It starts with the
            assumption that there are different definitions for a reason. In the case
            of E-plus, because there are different revenue streams and different user
            types, it makes sense to list the various forms of ARPU as E-plus does
            in some of its reports as it builds up to the overall ARPU that is reported
            to the parent company. Let’s try to take it to the next level. At the high-
            est level, there are four different revenue components: fees (including
            various roaming fees), discounts, incoming revenues, and the correc-
            tions. There are also three different user types: active users, total users,
            and non-E-plus users. The full context unravels when we plot the rev-
            enue items and user types in a matrix (see Table 6.5).
              The ARPU matrix doesn’t mean there is no ARPU performance indi-
            cator anymore; it is still an important indicator. But now we have a sin-
            gle context of the truth, and we can analyze the various components
            for deeper insight. The higher the percentage of total revenue and
            ARPU for fees and incoming revenues from active users, the better it
            is; this is revenue you can influence with customers you engage with.
            This is called controlled revenue. The higher the roaming revenues
            from non-E-plus customers and the higher the incoming revenues, the
            more you depend on others, uncontrolled revenue. Although uncon-
            trolled revenue is part of the business model, that revenue needs to be


            Table 6.5

            E-plus User Matrix
                                    Active Users    Total             Non-E-plus
                                    (in millions)    Customers (in    Users (in
                                                     millions)        millions)
            Fees                    1,900            +60              +250
            Discounts               –170             –90               N/A
            Incoming Revenue         480             NA                +30
            Corrections               20             +15                +5
            Total                   2,230           2,215             2,500
            AIPU = 1,900 million divided by the number of active users
            Clean ARPU = 2,215 million divided by the total number of users
            ARPU including allocations = 2,500 million divided by the total number of users