
Page 124 - Performance Leadership
P. 124
Chapter 7 Business Interfaces Drive Collaboration • 113
handover process, as well as an accurate estimate of the
response rate.
• Avoiding storing products in a warehouse depends on
manufacturing and logistics closely aligning their overall plans
and putting systems in place that on a real-time or daily basis
synchronize the output of the manufacturing process with the
input for the logistics process.
• The majority of the total cost of ownership (TCO) of systems is
in IT operations, but it’s the decisions made in IT development
that heavily influence the future TCO.
Business interface metrics encourage involvement of business
domains in each other’s processes so that it becomes a natural thought
process. Let’s have a look at our IT example again. The IT develop-
ment manager and the IT operations manager co-own the business
interface metrics that measure the efficiency and effectiveness of tak-
ing new developments into production. At first, when the CIO intro-
duces these metrics, both managers may even complain that they
cannot make their targets without the help of the other manager. The
reaction of the CIO should be affirmative; the metrics and targets were
put in place to drive collaboration. However, it does not end there for
the CIO. Where the two managers have co-ownership of the business
interface, it is the responsibility of the CIO to manage the collabora-
tion. In the end, the adage “shared responsibility is no responsibility”
still makes sense.
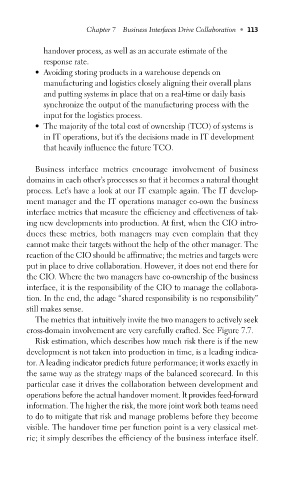
The metrics that intuitively invite the two managers to actively seek
cross-domain involvement are very carefully crafted. See Figure 7.7.
Risk estimation, which describes how much risk there is if the new
development is not taken into production in time, is a leading indica-
tor. A leading indicator predicts future performance; it works exactly in
the same way as the strategy maps of the balanced scorecard. In this
particular case it drives the collaboration between development and
operations before the actual handover moment. It provides feed-forward
information. The higher the risk, the more joint work both teams need
to do to mitigate that risk and manage problems before they become
visible. The handover time per function point is a very classical met-
ric; it simply describes the efficiency of the business interface itself.