
Page 125 - Performance Leadership
P. 125
114 • Part II Operational and Analytical Dimensions
F igur e 7.7
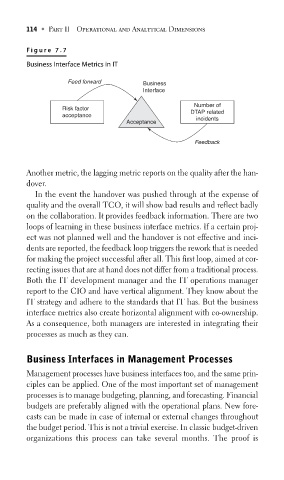
Business Interface Metrics in IT
Feed forward Business
Interface
Number of
Risk factor DTAP related
acceptance incidents
Acceptance
Feedback
Another metric, the lagging metric reports on the quality after the han-
dover.
In the event the handover was pushed through at the expense of
quality and the overall TCO, it will show bad results and reflect badly
on the collaboration. It provides feedback information. There are two
loops of learning in these business interface metrics. If a certain proj-
ect was not planned well and the handover is not effective and inci-
dents are reported, the feedback loop triggers the rework that is needed
for making the project successful after all. This first loop, aimed at cor-
recting issues that are at hand does not differ from a traditional process.
Both the IT development manager and the IT operations manager
report to the CIO and have vertical alignment. They know about the
IT strategy and adhere to the standards that IT has. But the business
interface metrics also create horizontal alignment with co-ownership.
As a consequence, both managers are interested in integrating their
processes as much as they can.
Business Interfaces in Management Processes
Management processes have business interfaces too, and the same prin-
ciples can be applied. One of the most important set of management
processes is to manage budgeting, planning, and forecasting. Financial
budgets are preferably aligned with the operational plans. New fore-
casts can be made in case of internal or external changes throughout
the budget period. This is not a trivial exercise. In classic budget-driven
organizations this process can take several months. The proof is