
Page 242 - Performance Leadership
P. 242
Chapter 12 Performance Networks • 231
should be performance indicators that point out how much in costs was
saved for the stakeholder, how much return was generated, and how
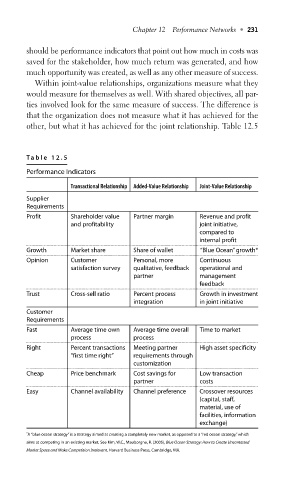
much opportunity was created, as well as any other measure of success.
Within joint-value relationships, organizations measure what they
would measure for themselves as well. With shared objectives, all par-
ties involved look for the same measure of success. The difference is
that the organization does not measure what it has achieved for the
other, but what it has achieved for the joint relationship. Table 12.5
Table 12.5
Performance Indicators
Transactional Relationship Added-Value Relationship Joint-Value Relationship
Supplier
Requirements
Profit Shareholder value Partner margin Revenue and profit
and profitability joint initiative,
compared to
internal profit
Growth Market share Share of wallet “Blue Ocean”growth*
Opinion Customer Personal, more Continuous
satisfaction survey qualitative, feedback operational and
partner management
feedback
Trust Cross-sell ratio Percent process Growth in investment
integration in joint initiative
Customer
Requirements
Fast Average time own Average time overall Time to market
process process
Right Percent transactions Meeting partner High asset specificity
“first time right” requirements through
customization
Cheap Price benchmark Cost savings for Low transaction
partner costs
Easy Channel availability Channel preference Crossover resources
(capital, staff,
material, use of
facilities, information
exchange)
* A “blue ocean strategy”is a strategy aimed at creating a completely new market, as opposed to a “red ocean strategy,”which
aims at competing in an existing market. See Kim, W.C., Mauborgne, R. (2005), Blue Ocean Strategy: How to Create Uncontested
Market Space and Make Competition Irrelevant, Harvard Business Press, Cambridge, MA.