
Page 173 - Petroleum Geology
P. 173
150
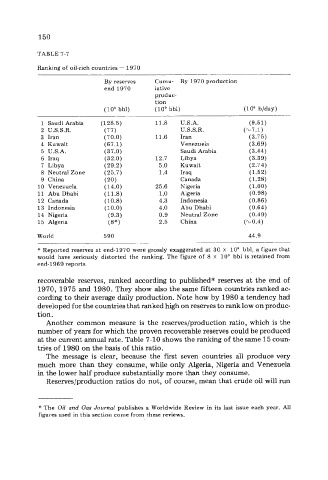
TABLE 7-7
Ranking of oil-rich countries - 1970
By reserves Cumu- By 1970 production
end-1970 lative
produc-
tion
( lo9 bbl) ( lo9 bbl) (lo6 b/day)
1 Saudi Arabia (128.5) 11.8 U.S.A. (9.51)
2 U.S.S.R. (77) U.S.S.R. (2.7.1)
3 Iran (70.0) 11.6 Iran (3.75)
4 Kuwait (67.1) Venezuela (3.69)
5 U.S.A. (37.0) Saudi Arabia (3.44)
6 Iraq (32.0) 12.7 Libya (3.39)
7 Libya (29.2) 5.0 Kuwait (2.74)
8 Neutral Zone (25.7) 1.4 Iraq (1.52)
9 China (20) Canada (1.28)
10 Venezuela (14.0) 25.6 Nigeria (1.00)
11 AbuDhabi (11.8) 1.0 Algeria (0.98)
12 Canada (10.8) 4.3 Indonesia (0.86)
13 Indonesia (10.0) 4.0 Abu Dhabi (0.64)
14 Nigeria (9.3) 0.9 Neutral Zone (0.49)
15 Algeria (8*) 2.5 China (~0.4)
World 590 44.9
* Reported reserves at end-1970 were grossly exaggerated at 30 X lo9 bbl, a figure that
would have seriously distorted the ranking. The figure of 8 X lo9 bbl is retained from
end-1969 reports.
recoverable reserve;;, ranked according to published* reserves at the end of
1970, 1975 and 1980. They show also the same fifteen countries ranked ac-
cording to their average daily production. Note how by 1980 a tendency had
developed for the countries that ranked high on reserves to rank low on produc-
tion.
Another common measure is the reserves/production ratio, which is the
number of years for which the proven recoverable reserves could be produced
at the current annual rate. Table 7-10 shows the ranking of the same 15 coun-
tries of 1980 on the basis of this ratio.
The message is clear, because the first seven countries all produce very
much more than they consume, while only Algeria, Nigeria and Venezuela
in the lower half produce substantially more than they consume.
Reserves/production ratios do not, of course, mean that crude oil will run
* The Oil and Gas Journal publishes a Worldwide Review in its last issue each year. All
figures used in this section come from these reviews.