
Page 175 - Petroleum Geology
P. 175
152
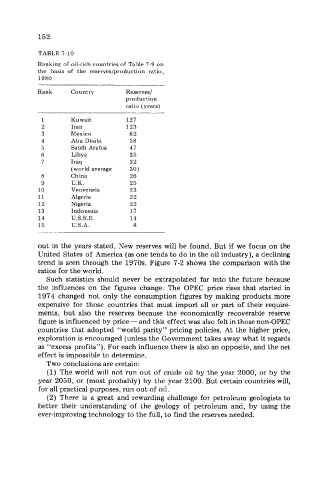
TABLE 7-10
Ranking of oil-rich countries of Table 7-9 on
the basis of the reserves/production ratio,
1980
Rank Country Reserves/
production
ratio (years)
Kuwait 127
Iran 123
Mexico 62
Abu Dhabi 58
Saudi Arabia 47
Libya 35
Iraq 32
(world average 30 1
a China 26
9 U.K. 25
10 Venezuela 23
11 Algeria 22
12 Nigeria 22
13 Indonesia 17
14 U.S.S.R. 14
15 U.S.A. 8
out in the years stated. New reserves will be found. But if we focus on the
United States of America (as one tends to do in the oil industry), a declining
trend is seen through the 1970s. Figure 7-2 shows the comparison with the
ratios for the world.
Such statistics should never be extrapolated far into the future because
the influences on the figures change. The OPEC price rises that started in
1974 changed not only the consumption figures by making products more
expensive for those countries that must import all or part of their require-
ments, but also the reserves because the economically recoverable reserve
figure is influenced by price - and this effect was also felt in those non-OPEC
countries that adopted “world parity” pricing policies. At the higher price,
exploration is encouraged (unless the Government takes away what it regards
as “excess profits”). For each influence there is also an opposite, and the net
effect is impossible to determine.
Two conclusions are certain:
(1) The world will not run out of crude oil by the year 2000, or by the
year 2050, or (most probably) by the year 2100. But certain countries will,
for all practical purposes, run out of oil.
(2) There is a great and rewarding challenge for petroleum geologists to
better their understanding of the geology of petroleum and, by using the
ever-improving technology to the full, to find the reserves needed.