
Page 180 - Petroleum Geology
P. 180
157
0.5 7
0
0
0
!Om 0
0
0
0 50 11
0
0
0
0.
Om .o*
0
0
5
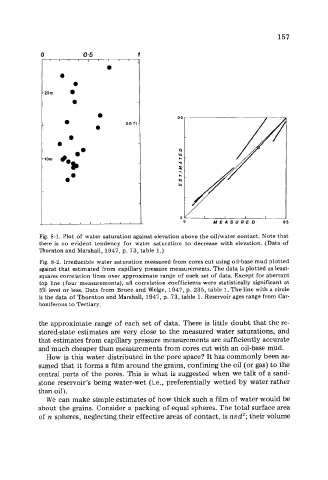
Fig. 8-1. Plot of water saturation against elevation above the oil/water contact. Note that
there is no evident tendency for water saturation to decrease with elevation. (Data of
Thornton and Marshall, 1947, p. 73, table 1.)
Fig. 8-2. Irreducible water saturation measured from cores cut using oil-base mud plotted
against that estimated from capillary pressure measurements. The data is plotted as least-
squares correlation lines over approximate range of each set of data. Except for aberrant
top line (four measurements), all correlation coefficients were statistically significant at
5% level or less. Data from Bruce and Welge, 1947, p. 235, table 1. The line with a circle
is the data of Thornton and Marshall, 1947, p. 73, table 1. Reservoir ages range from Car-
boniferous to Tertiary.
the approximate range of each set of data. There is little doubt that the re-
stored-state estimates are very close to the measured water saturations, and
that estimates from capillary pressure measurements are sufficiently accurate
and much cheaper than measurements from cores cut with an oil-base mud.
How is this water distributed in the pore space? It has commonly been as-
sumed that it forms a film around the grains, confining the oil (or gas) to the
central parts of the pores. This is what is suggested when we talk of a sand-
stone reservoir’s being water-wet (i.e., preferentially wetted by water rather
than oil).
We can make simple estimates of how thick such a film of water would be
about the grains. Consider a packing of equal spheres. The total surface area
of n spheres, neglecting their effective areas of contact, is n7rd2; their volume