
Page 199 - Petroleum Geology
P. 199
176
some areas of greatest water injection, the surface was even elevated by up to
25 cm.
This was not an isolated instance, but its setting made the consequences
more serious. M. ap Rhys Price, in his discussion of a paper by Kugler (1933,
p. 769), reported that subsidence over the Lagunillas field on the shore of
Lake Maracaibo, Venezuela, was found to be “in direct proportion with the
production taken out”.
The prevention of subsidence, as we have seen, was found to have a bene-
ficial effect on production; so compaction drive is not only undesirable but
also inefficient.
Secondary recovery
Production from an oil reservoir leads, in all but those reservoirs with
strong water or gas drive, to a gradual loss of pressure with time, and so to a
declining production rate. The obvious methods of maintaining production
(the word stimulation is usually restricted to methods of improving individual
well performance by improving the permeability around the well) is to do
artificially what Nature does - that is, to replace the oil produced by inject-
ing water close below the oil/water contact, or gas into the gas cap. We will
consider water flooding.
The energy of the water below the oil/water contact can be represented
by a potentiometric surface. If the water was originally static, the potentio-
metric surface was originally horizontal; but by the time water injection be-
35 2 1 1 5 0
WATER INJECTION
1 30
U
- 25
m
n
f 20
m
3
0
15
W
3 10
5
1937 47 57 67
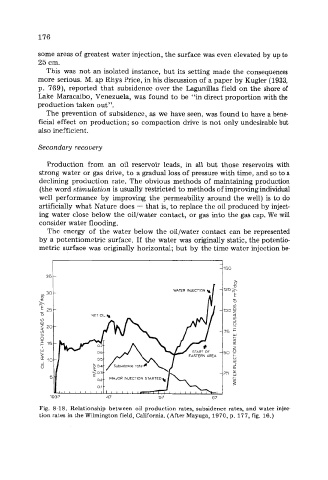
Fig. 8-18. Relationship between oil production rates, subsidence rates, and water injec-
tion rates in the Wilmington field, California. (After Mayuga, 1970, p. 177, fig. 16.)