
Page 197 - Petroleum Geology
P. 197
174
where p* is the reservoir pressure estimated from infinite closed-in time, and
p is the pressure measurement made at time AT after closing-in. When p is
plotted against the logarithm of the dimensionless time term, a straight line
is found. This method is due to Horner (1951) and such plots are called
Horner plots.
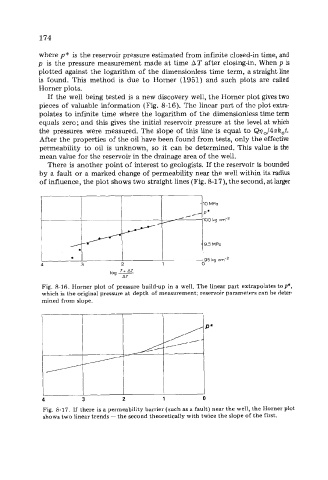
If the well being tested is a new discovery well, the Horner plot gives two
pieces of valuable information (Fig. 8-16). The linear part of the plot extra-
polates to infinite time where the logarithm of the dimensionless time term
equals zero; and this gives the initial reservoir pressure at the level at which
the pressures were measured. The slope of this line is equal to Q7?0/4nh,t.
After the properties of the oil have been found from tests, only the effective
permeability to oil is unknown, so it can be determined. This value is the
mean value for the reservoir in the drainage area of the well.
There is another point of interest to geologists. If the reservoir is bounded
by a fault or a marked change of permeability near the well within its radius
of influence, the plot shows two straight lines (Fig. 8-1 7), the second, at larger
Fig. 8-16. Horner plot of pressure build-up in a well. The linear part extrapolates top*,
which is the original pressure at depth of measurement; reservoir parameters can be deter-
mined from slope.
\ I \
P*
i
4 3 2 1 0
Fig. 8-17. If there is a permeability barrier (such as a fault) near the well, the Horner plot
shows two linear trends - the second theoretically with twice the slope of the first.