
Page 210 - Petroleum Geology
P. 210
187
Secondary migration updip follows a path, or paths, of local minimum
potential - much as rivers do - and migration continues until the oil arrives
in a position of minimum potential with respect to the physical constraints
of the cap rock. Here it accumulates. The quantity that can accumulate de-
pends on the volume of this space of minimum potential, and on the quanti:
ties of oil generated. If the space of minimum potential becomes entirely fill-
ed with oil, further secondary migration to it will result in overflow from the
spill point, which is a local position of minimum potential with respect to
the accumulation, and so the process will continue until the oil either reaches
another space of minimum potential or dissipates at the surface.
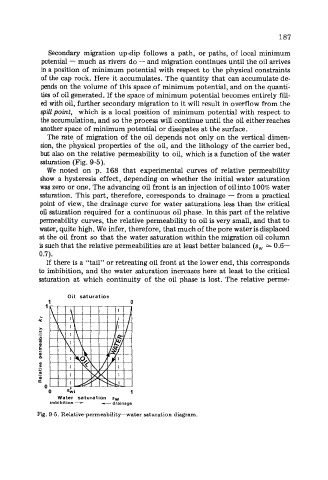
The rate of migration of the oil depends not only on the vertical dimen-
sion, the physical properties of the oil, and the lithology of the carrier bed,
but also on the relative permeability to oil, which is a function of the water
saturation (Fig. 9-5).
We noted on p. 168 that experimental curves of relative permeability
show a hysteresis effect, depending on whether the initial water saturation
was zero or one. The advancing oil front is an injection of oilinto 100% water
saturation. This part, therefore, corresponds to drainage - from a practical
point of view, the drainage curve for water saturations less than the critical
oil saturation required for a continuous oil phase. In this part of the relative
permeability curves, the relative permeability to oil is very small, and that to
water, quite high. We infer, therefore, that much of the pore water is displaced
at the oil front so that the water saturation within the migration oil column
is such that the relative permeabilities are at least better balanced (sw = 0.6-
0.7).
If there is a “tail” or retreating oil front at the lower end, this corresponds
to imbibition, and the water saturation increases here at least to the critical
saturation at which continuity of the oil phase is lost. The relative perme-
Oil saturation
1 0
1
L
-k
”
h
.- -
.-
P
0
E
n
P
.-
”
-
a
0
U
0
Water saturation sw
imbibition- -drainage
Fig. 9-5. Relative-permeability-water saturation diagram.