
Page 215 - Petroleum Geology
P. 215
192
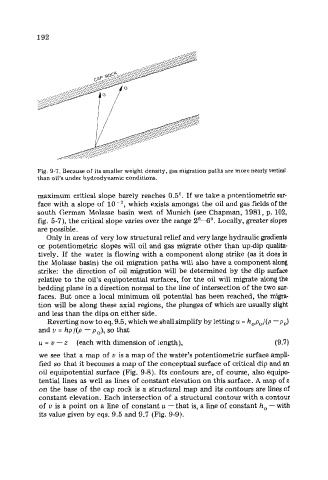
Fig. 9-7. Because of its smaller weight density, gas migration paths are more nearly vertical
than oil's under hydrodynamic conditions.
maximum critical slope barely reaches 0.5'. If we take a potentiometric sur-
face with a slope of which exists amongst the oil and gas fields of the
south German Molasse basin west of Munich (see Chapman, 1981, p. 102,
fig. 5-7), the critical slope varies over the range 2'--6O. Locally, greater slopes
are possible.
Only in areas of very low structural relief and very large hydraulic gradients
or potentiometric slopes will oil and gas migrate other than updip qualita-
tively. If the water is flowing with a component along strike (as it does in
the Molasse basin) the oil migration paths will also have a component along
strike: the direction of oil migration will be determined by the dip surface
relative to the oil's equipotential surfaces, for the oil will migrate along the
bedding plane in a direction normai to the Iine of intersection of the two sur-
faces. But once a local minimum oil potential has been reached, the migra-
tion will be along these axial regions, the plunges of which are usually slight
and less than the dips on either side.
Reverting now to eq. 9.5, which we shall simplify by letting u = h,p,/(p -po)
and u = hp /(p - o), so that
p
z
u = u - (each with dimension of length), (9.7)
we see that a map of u is a map of the water's potentiometric surface ampli-
fied so that it becomes a map of the conceptual surface of critical dip and an
oil equipotential surface (Fig. 9-8). Its contours are, of course, also equipo-
tential lines as well as lines of constant elevation on this surface. A map of z
on the base of the cap rock is a structural map and its contours are lines of
constant elevation. Each intersection of a structural contour with a contour
of u is a point on a line of constant u - that is, a line of constant ho - with
its value given by eqs. 9.5 and 9.7 (Fig. 9-9).