
Page 218 - Petroleum Geology
P. 218
195
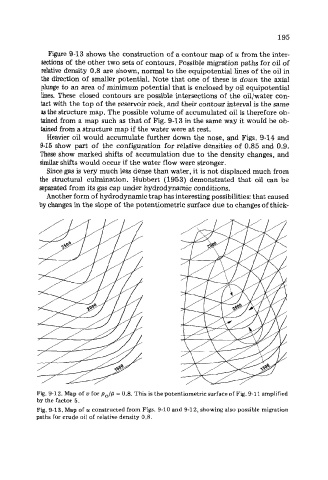
Figure 9-13 shows the construction of a contour map of u from the inter-
sections of the other two sets of contours, Possible migration paths for oil of
relative density 0.8 are shown, normal to the equipotential lines of the oil in
the direction of smaller potential. Note that one of these is down the axial
plunge to an area of minimum potential that is enclosed by oil equipotential
lines. These closed contours are possible intersections of the oil/water con-
tact with the top of the reservoir rock, and their contour interval is the same
as the structure map. The possible volume of accumulated oil is therefore ob-
tained from a map such as that of Fig. 9-13 in the same way it would be ob-
tained from a structure map if the water were at rest.
Heavier oil would accumulate further down the nose, and Figs. 9-14 and
9-15 show part of the configuration for relative densities of 0.85 and 0.9.
These show marked shifts of accumulation due to the density changes, and
similar shifts would occur if the water flow were stronger.
Since gas is very much less dense than water, it is not displaced much from
the structural culmination. Hubbert (1953) demonstrated that oil can be
separated from its gas cap under hydrodynamic conditions.
Another form of hydrodynamic trap has interesting possibilities: that caused
by changes in the slope of the potentiometric surface due to changes of thick-
Fig. 9-12. Map of u for po/p = 0.8. This is the potentiometric surface of Fig. 9-1 1 amplified
by the factor 5.
Fig. 9-13. Map of u constructed from Figs. 9-10 and 9-12, showing also possible migation
paths for crude oil of relative density 0.8.