
Page 72 - Petroleum Geology
P. 72
51
200 300 400 500 600 slrn
Porosity f
pslft I 0.5
ft
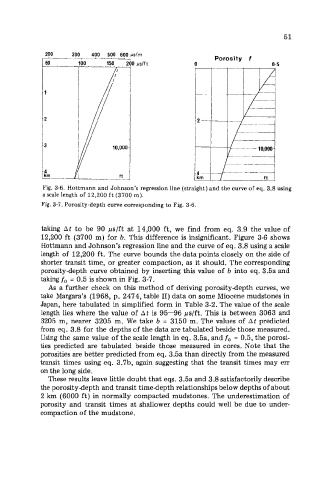
Fig. 3-6. Hottmann and Johnson’s regression line (straight) and the curve of eq. 3.8 using
a scale length of 12,200 ft (3700 m).
Fig. 3-7. Porosity-depth curve corresponding to Fig. 3-6.
taking At to be 90 ps/ft at 14,000 ft, we find from eq. 3.9 the value of
12,200 ft (3700 m) for b. This difference is insignificant. Figure 3-6 shows
Hottmann and Johnson’s regression line and the curve of eq. 3.8 using a scale
length of 12,200 ft. The curve bounds the data points closely on the side of
shorter transit time, or greater compaction, as it should. The corresponding
porosity-depth curve obtained by inserting this value of b into eq. 3.5a and
taking fo = 0.5 is shown in Fig. 3-7.
As a further check on this method of deriving porositydepth curves, we
take Margara’s (1968, p. 2474, table 11) data on some Miocene mudstones in
Japan, here tabulated in simplified form in Table 3-2. The value of the scale
length lies where the value of At is 95-96 ps/ft. This is between 3063 and
3205 m, nearer 3205 m. We take b = 3150 m. The values of At predicted
from eq. 3.8 for the depths of the data are tabulated beside those measured.
Using the same value of the scale length in eq. 3.5a, and fo = 0.5, the porosi-
ties predicted are tabulated beside those measured in cores. Note that the
porosities are better predicted from eq. 3.5a than directly from the measured
transit times using eq. 3.7b, again suggesting that the transit times may err
on the long side.
These results leave little doubt that eqs. 3.5a and 3.8 satisfactorily describe
the porositydepth and transit time-depth relationships below depths of about
2 km (6000 ft) in normally compacted mudstones. The underestimation of
porosity and transit times at shallower depths could well be due to under-
compaction of the mudstone.