
Page 68 - Petroleum Geology
P. 68
47
MEASURED POROSITY MINUS ESTIMATED POROSITY
(Percentage Points)
* + 8
*8
**
1- 0.
b b
- - 5000
5000
** 8
2-
ft
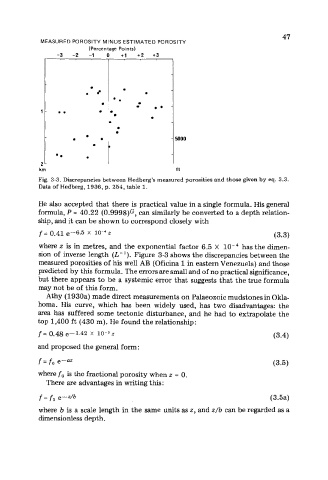
Fig. 3-3. Discrepancies between Hedberg's measured porosities and those given by eq. 3.3.
Data of Hedberg, 1936, p. 254, table 1.
He also accepted that there is practical value in a single formula. His general
formula, P = 40.22 (0.9998)G, can similarly be converted to a depth relation-
ship, and it can be shown to correspond closely with
f = 0.41 e-6.5 X z (3.3)
where z is in metres, and the exponential factor 6.5 X has the dimen-
sion of inverse length (I,-'). Figure 3-3 shows the discrepancies between the
measured porosities of his well AB (Oficina 1 in eastern Venezuela) and those
predicted by this formula. The errors are small and of no practical significance,
but there appears to be a systemic error that suggests that the true formula
may not be of this form.
Athy (1930a) made direct measurements on Palaeozoic mudstones in Okla-
homa. His curve, which has been widely used, has two disadvantages: the
area has suffered some tectonic disturbance, and he had to extrapolate the
top 1,400 ft (430 m). He found the relationship:
f = 0.48 e-1.42 X z (3.4)
and proposed the general form:
f = fa e-az (3.5)
where fa is the fractional porosity when z = 0.
There are advantages in writing this:
f = fa e-db (3.5a)
where b is a scale length in the same units as z, and z/b can be regarded as a
dimensionless depth.