
Page 69 - Petroleum Geology
P. 69
48
The differences between Hedberg’s and Athy’s curves are not to be explain-
ed by compromise. Almost certainly they are due to the role of time and
temperature, neither of which is explicitly included in the formula. It is ap-
parent that there is no such thing as a simple depth-porosity formula that has
general validity. The local constants, f, and b, are not universal and their local
value takes local conditions into account.
Mudstone compaction curves determined by direct measuremdnt are too
time-consuming to be in general use, and we must resort to indirect measure-
ment through geophysical measurements made in the borehole of the rocks
close to the wall of the borehole. Satisfactory mudstone compaction curves
can be constructed from the sonic log, which measures the inverse of the
sonic velocity in the rocks close to the wall of the borehole (see p. 130) and
records this in units of microseconds per foot or per metre against depth. If
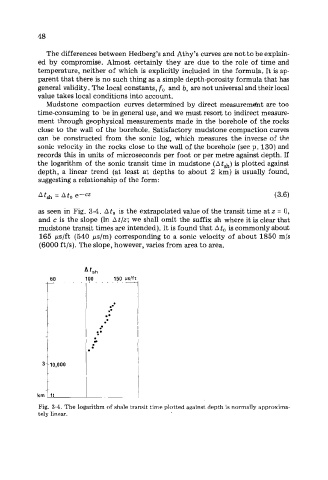
the logarithm of the sonic transit time in mudstone (A tsh) is plotted against
depth, a linear trend (at least at depths to about 2 km) is usually found,
suggesting a relationship of the form:
At& = Ato e-cz (3.6)
as seen in Fig. 3-4. At, is the extrapolated value of the transit time at z = 0,
and c is the slope (In At/z; we shall omit the suffix sh where it is clear that
mudstone transit times are intended). It is found that A to is commonly about
165 ps/ft (540 ps/m) corresponding to a sonic velocity of about 1850 m/s
(6000 ft/s). The slope, however, varies from area to area.
km ft
Fig. 3-4. The logarithm of shale transit time plotted against depth is normally approxima-
tely linear.