Page 212 - Petrophysics 2E
P. 212

PERMEABILlTY-POROSITY RELATIONSHIPS              I85
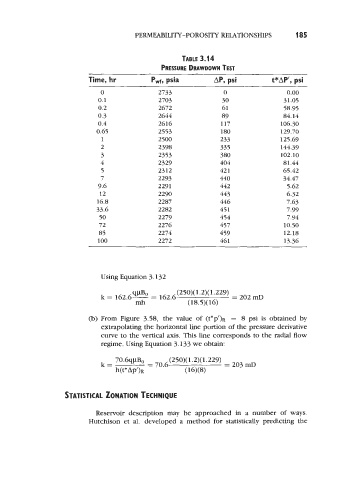

                                                        TABLE 3.14
                                                  PRESSURE DRAWDOWN TEST
                            Time, hr           Pd, psia           AP,  psi          t*AP’,  psi

                                0                2733                0                  0.00
                               0.1               2703                30                31.05
                               0.2               2672                61                58.95
                               0.3               2644                89                84.14
                               0.4               2616               117               106.30
                              0.65               2553               180                129.70
                                1                2500               233               125.69
                                2                2398               335               144.39
                                3                2353               380                102.10
                                4                2329               404                81.44
                                5                2312               42  1              65.42
                                7                2293               440                34.47
                               9.6               2291               442                 5.62
                               12                2290               443                 6.32
                               16.8              2287               446                 7.63
                              33.6               2282               45  1               7.99
                               50                2279               454                 7.94
                               72                2276               457                 10.50
                               85                2274               459                 12.18
                               100               2272               461                 13.36


                                Using Equation 3.132

                                         qwo           (250)( 1.2)( 1.229)
                                k = 162.6-     = 162.6                  = 202 mD
                                          mh              (18.5)( 16)

                                From  Figure  3.58,  the value  of  (t*p’)R  =  8 psi  is  obtained by
                                extrapolating the horizontal line portion of  the pressure derivative
                                curve to the vertical axis. This line corresponds to the radial flow
                                regime. Using Equation 3.133 we obtain:

                                    70.6qyB0         (250)(1.2)( 1.229)
                                k=            = 70.6                 = 203 mD
                                    h(t*Ap’)R             (16)(8)


                     STATISTICAL ZONATION TECHNIQUE


                              Reservoir  description  may  be  approached  in  a  number  of  ways.
                            Hutchison  et  al.  developed a  method for  statistically predicting  the
   207   208   209   210   211   212   213   214   215   216   217