
Page 216 - Petrophysics 2E
P. 216
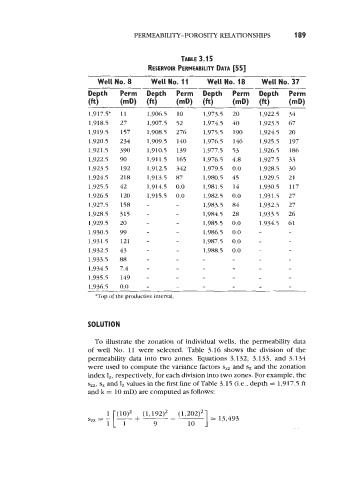
PERMEABILITY-POROSITY RELATIONSHIPS              189


                                                        TABLE 3.15
                                              RESERVOIR PERMEABILITY DATA [55]

                               Well No. 8      Well No. 11      Well No.  18     Well No. 37
                            Depth     Perm  Depth      Perm  Depth      Perm  Depth      Perm
                            (W        (mD)  (W         (mD)    (fit)    (mD)  (W         (mD)

                            1,917.5*  11      1,9065   10      1,973.5  20      1,922.5  34
                            1,918.5   27      1,907.5  52      1,974.5  40      1,923.5  67
                            1,919.5   157     1,908.5  276     1,975.5  190     1,924.5  20
                            1,920.5   234     1,909.5  140     1,976.5  146     1,925.5  197
                            1,921.5   390     1,910.5  139     1,977.5  53      1,926.5  186
                            1,922.5   90      1,911.5  165     1,976.5  4.8     1,927.5  33
                            1,923.5   192     1,912.5  342     1,979.5  0.0     1,928.5  30
                            1,924.5   218     1,913.5  87      1,980.5  45      1,929.5   21
                            1,925.5   42      1,914.5  0.0     1,981.5  14      1,930.5   117
                            1,926.5   120     1,915.5  0.0     1,982.5  0.0     1,931.5  27
                            1,927.5   158     -        -       1,983.5  84      1,932.5  27
                            1,928.5   315     -        -       1,984.5  28      1,933.5  26
                            1,929.5   20      -        -       1,985.5   0.0    1,934.5  61
                            1,930.5   99      -        -       1,986.5   0.0    -        -
                            1,93 1.5   121    -        -       1,987.5  0.0     -        -
                            1,932.5   43      -        -       1,988.5  0.0     -        -
                            1,933.5   88      -        -       -        -       -        -
                            1,934.5   7.4     -        -       -        -       -        -
                            1,935.5   149     -        -       -        -       -        -
                            1.936.5   0.0     -        -       -        -       -        -
                              "Top of the productive interval.


                            SOLUTION

                              To illustrate the zonation of  individual wells, the permeability data
                            of  well  No.  11  were  selected.  Table  3.16 shows the  division of  the
                            permeability data into two zones.  Equations 3.132,  3.133, and 3.134
                            were used to compute the variance factors szz and sz and the zonation
                            index Iz, respectively, for each division into two zones. For example, the
                            szz, sz and I,  values in the first line of Table 3.15 (Le., depth = 1,917.5 ft
                            and k = 10 mD) are computed as follows: