
Page 217 - Petrophysics 2E
P. 217
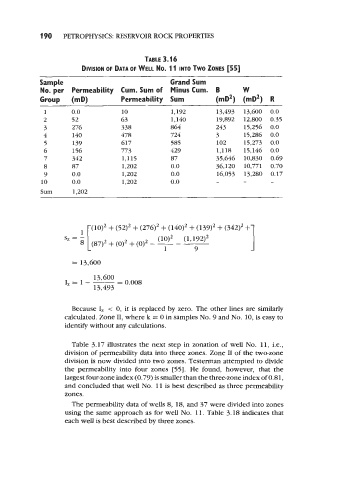
190    PETROPHYSICS: RESERVOIR ROCK PROPERTIES


                                             TABLE 3.16
                          DIVISION OF DATA OF WELL NO.  1 1 INTO TWO ZONES  [55]

             Sample                                  Grand Sum
             No. per  Permeability  Cum. Sum of  Minus Cum.  B             W
             Group     (mD)           Permeability  Sum            (mD2)  (mD2)  R

              1        0.0            10             1,192         13,493  13,600  0.0
              2        52             63             1,140         19,892  12,800  0.35
              3        276            338            864           243     15,256  0.0
              4        140            478            724           3       15,286  0.0
              5        139            617            585           102     15,273  0.0
              6        156            773            429           1,118   15,146  0.0
              7        342            1,115          87            35,646  10,830  0.69
              8        87             1,202          0.0           36,120  10,771  0.70
              9        0.0            1,202          0.0           16,053  13,280  0.17
              10       0.0            1,202          0.0           -       -        -
             SUm       1,202


                                  + (52)2 + (276)2 + (140)2 + (139)2 + (342)2 +

                             (87)2 + (0)2 +    - -
                     sz = -                            -  (1, 19a2
                                                   1        9
                       = 13,600

                              13,600
                     Iz=l---         - 0.00s
                              13,493


                       Because Iz  < 0, it is replaced by  zero. The other lines are similarly
                     calculated. Zone II, where k = 0 in samples No. 9 and No.  10, is easy to
                     identify without any calculations.


                       Table 3.17 illustrates the next step in zonation of  well No.  11, Le.,
                     division of  permeability data into three zones. Zone I1 of the two-zone
                     division is now divided into two zones. Testeman attempted to divide
                     the permeability into four zones  [55]. He  found,  however,  that  the
                     largest four-zone index (0.79) is smaller than the three-zone index of 0.81,
                     and concluded that well No.  11 is best described as three permeability
                     zones.
                       The permeability data of wells 8, 18, and 37 were divided into zones
                     using the same approach as for well No.  11. Table 3.18 indicates that
                     each well is best described by three zones.