
Page 281 - Petrophysics 2E
P. 281
254 PETROPHYSICS: RESERVOIR ROCK PROPERTIES
v I I I I I 1 1 I -... Yl
,
- 100
W
e
16
0.1 I I I I I I
10 100
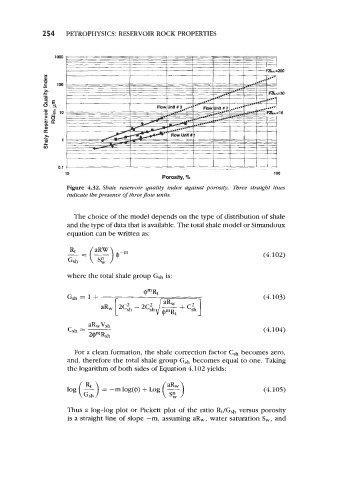
Porosity, %
Figure 4.32. Shale reservoir quality index against porosity. Three straight lines
indicate the presence of threepow units.
The choice of the model depends on the type of distribution of shale
and the type of data that is available. The total shale model or Simandoux
equation can be written as:
(4.102)
where the total shale group Gsh is:
(4.103)
(4.104)
For a clean formation, the shale correction factor Csh becomes zero,
and, therefore the total shale group Gsh becomes equal to one. Taking
the logarithm of both sides of Equation 4.102 yields:
log (5) = -m log(@) + Log (4.105)
Gsh
Thus a log-log plot or Pickett plot of the ratio Rt/Gsh versus porosity
is a straight line of slope -m, assuming aR,, water saturation Sw, and