
Page 298 - Petrophysics 2E
P. 298
LAB-DERIVED EVALUATION OF SHALY 269
shaly core samples can be determined from the C, vs. C, plot (such
as Figure 4.33) at TL. According to Figure 4.33, the intercept of the
extrapolated straight-line portion of the curve is equal to QV/F*
and F* is determined from the slope of this straight line, therefore
Qv values can be calculated. For a laboratory temperature of 25"C,
= 38.3 cm*equiv-'ohm-'.
Hoyer and Spann showed that measurements of electrical properties
of a core sample are subject to considerable error if they are made before
the rock and its saturating fluid reach equilibrium, which can lead to
serious errors in calculating the reservoir fluid saturations [29]. The
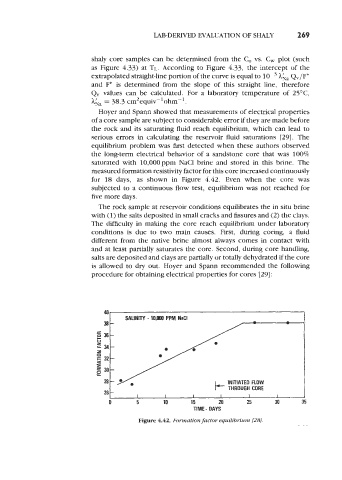
equilibrium problem was first detected when these authors observed
the long-term electrical behavior of a sandstone core that was 100%
saturated with 10,000ppm NaCl brine and stored in this brine. The
measured formation resistivity factor for this core increased continuously
for 18 days, as shown in Figure 4.42. Even when the core was
subjected to a continuous flow test, equilibrium was not reached for
five more days.
The rock sample at reservoir conditions equilibrates the in situ brine
with (1) the salts deposited in small cracks and fissures and (2) the clays.
The difficulty in making the core reach equilibrium under laboratory
conditions is due to two main causes. First, during coring, a fluid
different from the native brine almost always comes in contact with
and at least partially saturates the core. Second, during core handling,
salts are deposited and clays are partially or totally dehydrated if the core
is allowed to dry out. Hoyer and Spann recommended the following
procedure for obtaining electrical properties for cores [29] :
40-
SALINITY - 10.000 PPM NaCl -
*
38- -
E 36-
4
u34-
2
E 32-
I
30-
0,
26 /- I+- INITIATED ROW 1
THROUGH CORE
I I I I I I
Figure 4.42. Formation factor equilfbrium [28].