
Page 323 - Petrophysics 2E
P. 323
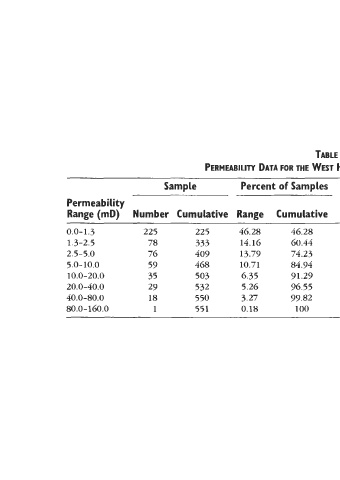
TABLE 4.20
                                             PERMEABILITY DATA FOR THE WEST HOWARD~LASSCOCK ZONE D
                                                                                          UNIT,
                                    Sample          Percent of Samples         Arithmetic            Geometric           Percent
               Permeability                                              Average        F          Log      Average    Permeability
               Range (mD)    Number  Cumulative  Range  Cumulative           k     (Average k)  Average         k        Capacity
               0.0-1.3          225        225      46.28      46.28       0.399      0.185     -0.39922   -0.18476        3.135
               1.3-2.5           78        333      14.16      60.44        1.762     0.249      0.24589     0.03481       4.235
               2.5-5.0           76        409      13.79      74.23        0.355     0.489      0.54975     0.07583       8.307
               5.0- 10.0         59        468      10.71      84.94       6.895      0.738      0.83853     0.08979      12.539
               10.0-20.0         35        503      6.35       91.29       13.714     0.871       1.13717    0.07223      14.795
               20.0-40.0         29        532      5.26       96.55      27.931      1.470      1.44609     0.0761  1    24.966
               40.0-80.0         18        550      3.27       99.82      52.222      1.706      1.71786     0.05612      28.973
               80.0-160.0         1        551      0.18        100       99.000      0.180      1.99564     0.00362       3.051