
Page 328 - Petrophysics 2E
P. 328
FORMATION EVALUATION 297
1,000
lf
$
c
0
m
*
* .- 100
lo
1
0.01 0.1 1 10
Porosity,+, Fraction
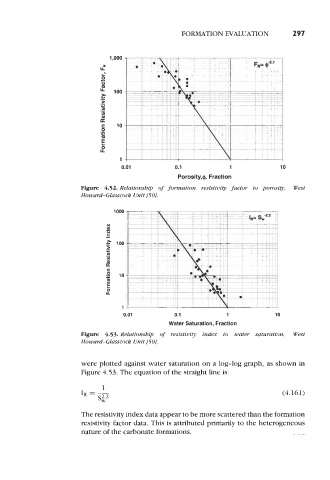
Figure 4.52. Relationship of formation resistivity factor to porosity, West
Howard-Glasscock Unit 1501.
lo00
X
0
-
U
C
.- i-?
100
5 .-
c
.-
u)
u)
B
C
g 10
m
LL
1
0.01 0.1 1 10
Water Saturation, Fraction
Figure 4.53. Relutionsbip of resistivity index to water saturation, West
Howard-Glasscock Unit 1501.
were plotted against water saturation on a log-log graph, as shown in
Figure 4.53. The equation of the straight line is:
(4.161)
The resistivity index data appear to be more scattered than the formation
resistivity factor data. This is attributed primarily to the heterogeneous
nature of the carbonate formations.