
Page 358 - Petrophysics 2E
P. 358
326 PETROPHYSICS: RESERVOIR ROCK PROPERTIES
that play a decisive role in the behavior of the capillary pressure curves.
Therefore, when mercury injection data are normalized to represent
water-oil systems, the state of wettability must be considered.
The mercury injection method has two disadvantages:
(1) after mercury is injected into a core, it cannot be used for any other
tests because the mercury cannot be safely removed, and
(2) mercury vapor is toxic, so strict safety precautions must be followed
when using mercury.
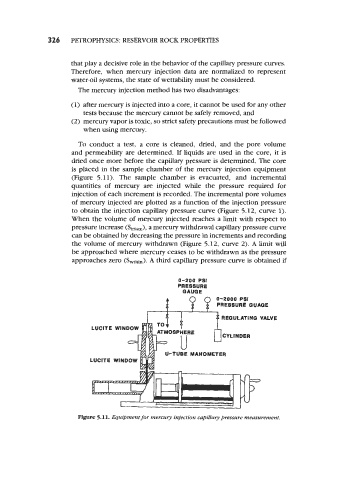
To conduct a test, a core is cleaned, dried, and the pore volume
and permeability are determined. If liquids are used in the core, it is
dried once more before the capillary pressure is determined. The core
is placed in the sample chamber of the mercury injection equipment
(Figure 5.11). The sample chamber is evacuated, and incremental
quantities of mercury are injected while the pressure required for
injection of each increment is recorded. The incremental pore volumes
of mercury injected are plotted as a function of the injection pressure
to obtain the injection capillary pressure curve (Figure 5.12, curve 1).
When the volume of mercury injected reaches a limit with respect to
pressure increase (S-), a mercury withdrawal capillary pressure curve
can be obtained by decreasing the pressure in increments and recording
the volume of mercury withdrawn (Figure 5.12, curve 2). A limit will
be approached where mercury ceases to be withdrawn as the pressure
approaches zero (Swmh>. A third capillary pressure curve is obtained if
0-200 PSI
PRESSURE
GAUQE
0-2000 PSI
PRESSURE WAGE
REGULATING VALVE
LUCITE WINDOW
LUClTE WINDOW
Figure 5.11. Equdpment for mercury Injection Capillary pressure measurement.