
Page 359 - Petrophysics 2E
P. 359
MEASUREMENT OF CAPILLARY PRESSURE 327
100- 1-Injection Curve
2-Withdrawal Curve
3-Reinjection Curve
10-
h
E
w'
U
9
u)
fn
w
B 1-
Pct
-
0 -
0 simax 0:s Swmin 1.0
MERCURY SATURATION, % PV
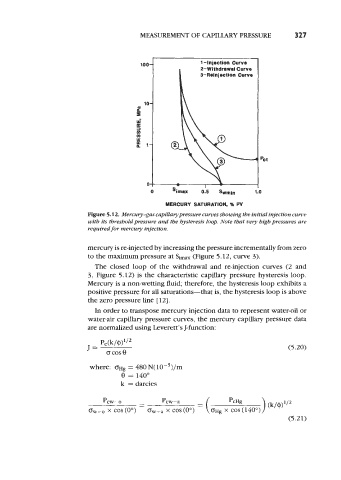
Figure 5.12. Merculy-gas capillarypressure curves showing the initial injection cuwe
with its threshold pressure and tbe hysteresis loop. Note that vev high pressures are
required for mercury injection.
mercury is re-injected by increasing the pressure incrementally from zero
to the maximum pressure at Sima (Figure 5.12, curve 3).
The closed loop of the withdrawal and re-injection curves (2 and
3, Figure 5.12) is the characteristic capillary pressure hysteresis loop.
Mercury is a non-wetting fluid therefore, the hysteresis loop exhibits a
positive pressure for all saturations-that is, the hysteresis loop is above
the zero pressure line [ 121.
In order to transpose mercury injection data to represent water41 or
water-air capillary pressure curves, the mercury capillary pressure data
are normalized using Leverett's J-function:
(5.20)
where: 0~~ = 480 N( 10-3)/m
0 = 140"
k = darcies
pcw-0 - Pcw-a PcHg
-
x COS (0") x COS (0") = (0~~ (140")
x
COS
(5.21)