
Page 364 - Petrophysics 2E
P. 364
332 PETROPHYSICS: RESERVOIR ROCK PROPERTIES
40 i
0
-80 -7
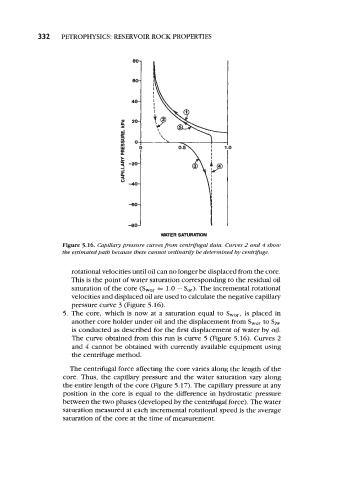
Figure 5.16. Capillarypressure curves from centrifugal data. Curves 2 and 4 show
the estimated path because these cannot ordinarily be determined by centrifuge.
rotational velocities until oil can no longer be displaced from the core.
This is the point of water saturation corresponding to the residua1 oil
saturation of the core (Swor = 1.0 - S,,). The incremental rotational
velocities and displaced oil are used to calculate the negative capillary
pressure curve 3 (Figure 5.16).
5. The core, which is now at a saturation equal to Swor, is placed in
another core holder under oil and the displacement from to Si,
is conducted as described for the first displacement of water by oil.
The curve obtained from this run is curve 5 (Figure 5.16). Curves 2
and 4 cannot be obtained with currently available equipment using
the centrifuge method.
The centrifugal force affecting the core varies along the length of the
core. Thus, the capillary pressure and the water saturation vary along
the entire length of the core (Figure 5.17). The capillary pressure at any
position in the core is equal to the difference in hydrostatic pressure
between the two phases (developed by the centrifugal force). The water
saturation measured at each incremental rotational speed is the average
saturation of the core at the time of measurement.