Page 381 - Petrophysics 2E
P. 381

VERTICAL SATURATION PROFILE IN A RESERVOIR              349


                                                       \

                                        -
                                        -4
                                        -I  6-
                                        2
                                        0   4-                                        CI
                                                                                      c
                                                                                      .-
                                                                                       W
                                           2-
                                           0       I                     FWL
                                             0   0.2  t 0.4   0.6   0.8   1.0
                                                                  t
                                                    Slw           Swor
                                                  WATER  SATUR All 0 N
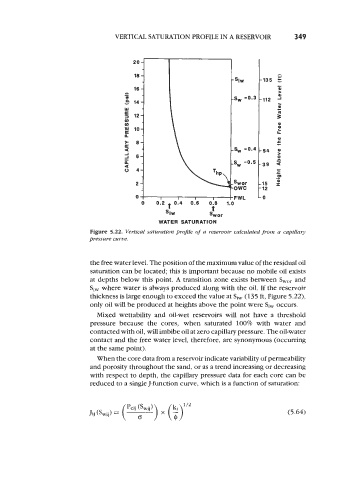
                             Figure 5.22. Vertfcal Saturation profile of a  reservoir calculated from a capillaq?
                             pressure curve.


                             the free water level. The position of the maximum value of the residual oil
                             saturation can be located; this is important because no mobile oil exists
                             at depths below this point. A transition zone exists between S,,,   and
                             Si,  where water is always produced along with the oil. If the reservoir
                             thickness is large enough to exceed the value at Si,  (135 ft, Figure 5.22),
                             only oil will be produced at heights above the point were Si,  occurs.
                               Mixed  wettability and  oil-wet reservoirs  will  not  have  a threshold
                             pressure  because  the  cores,  when  saturated  100% with  water  and
                             contacted with oil, will imbibe oil at zero capillary pressure. The oil-water
                             contact and the free water level, therefore, are synonymous (occurring
                             at the same point).
                               When the core data from a reservoir indicate variability of permeability
                             and porosity throughout the sand, or as a trend increasing or decreasing
                             with respect to depth, the capillary pressure data for each core can be
                             reduced to a single J-function curve, which is a function of saturation:


                                                                                          (5.64)
   376   377   378   379   380   381   382   383   384   385   386