Page 382 - Petrophysics 2E
P. 382
350    PETROPHYSICS: RESERVOIR ROCK PROPERTIES


                         where:


                         (1) subscript i indicates the individual cores tested, and
                         (2)  subscript j indicates values of J and Pc with respect to the specific
                             core and data point (Swij).

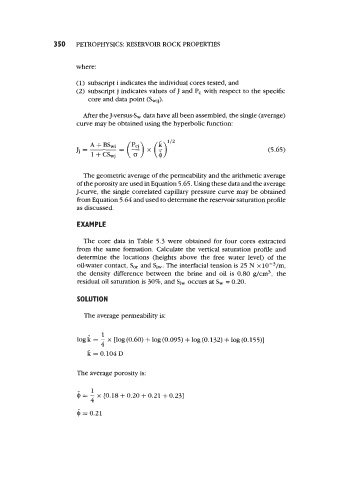
                            After the J-versus-S,  data have all been assembled, the single (average)
                         curve may be obtained using the hyperbolic function:


                                                                                      (5.65)


                            The geometric average of the permeability and the arithmetic average
                         of the porosity are used in Equation 5.65. Using these data and the average
                         J-curve, the single correlated capillary pressure curve may be obtained
                          from Equation 5.64 and used to determine the reservoir saturation profile
                          as discussed.

                          EXAMPLE

                            The core data in Table 5.3 were obtained for four cores extracted
                          from the same formation. Calculate the vertical saturation profile and
                          determine the  Iocations  (heights above  the  free water  level)  of  the
                          oil-water contact, So,  and Si,.   The interfacial tension is 25 N  x 10-3/m,
                          the density difference between the brine and  oil is 0.80 g/cm3, the
                          residual oil saturation is 30%, and Si,  occurs at S, = 0.20.


                          SOLUTION

                            The average permeability is:


                                 1
                          logE =  x [log (0.60) + log (0.095) + log (0.132) + log  (0.155)]

                             k = 0.104 D


                          The average porosity is:

                          4 - - x L0.18 + 0.20 + 0.21 + 0.231
                              1
                           -4

                          Q = 0.21

