
Page 190 - Petrophysics
P. 190
PERMEABILITY-POROSITY RELATIONSHIPS 163
Considerable progress in the field of numerical methods and computer
modeling during the past twenty-five years has provided very useful
answers to these three questions. Unfortunately, a necessary condition
for the practical use of these models is that the reservoir be adequately
described. In spite of all the advances in core analysis, well logging,
geostatistics, and in particular well testing, petroleum engineers are
still unable to specify the nature and extent of heterogeneities at every
point in the formation. Warren and Price stated that “In many cases,
the predicted performance of a reservoir is so completely dominated
by irregularities in the physical properties of the formation that the
gratuitous assumption of a particular form for the variation can reduce the
solution of the problem to a mere tautological exercise” [48]. Fortunately,
however, whereas all porous media are microscopically heterogeneous,
only macroscopic variations of the rock need to be considered because
the fundamental concepts of fluid flow in porous media are based on
macroscopic quantities. Inasmuch as rock samples are usually available
only from a small portion of the total reservoir, it seems logical that if
measurements from these samples were to be used to infer the properties
of the actual reservoir, the data should be treated statistically.
PERMEABILITY AND POROSITY DISTRIBUTIONS
Lorenz coefficient LK
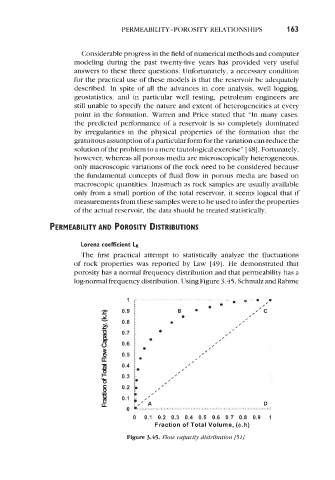
The first practical attempt to statistically analyze the fluctuations
of rock properties was reported by Law [49]. He demonstrated that
porosity has a normal frequency distribution and that permeability has a
log-normal frequency distribution. Using Figure 3.45, Schmalz and Rahme
1
0.9
0.8
0.7
,
0.6 ,
0
0
0.5 0
0.4
0.3
,
0.2 0
,
0
/,,:/;.:,;;-,, , , , , , , , , , , , , , , , , , , , , , , , , , ,D
,
,
/
0.1 0 1
Y0 A D
0
0 0.1 0.2 0.3 0.4 0.5 0.6 0.7 0.8 0.9 1
Fraction of Total Volume, (4.h)
Figure 3.45. Flow capacity distribution [51/.