
Page 192 - Petrophysics
P. 192
PERMEABILITY-POROSITY RELATIONSHIPS 165
100
80
60
0
E 9
E
!
20
10
z 8
P 6
?
W d
v1
2
1
12 5 10 20 9 60 80 90 95 98 99 99.5
Portiin of Total Sample Having Hi-r Pemreabili
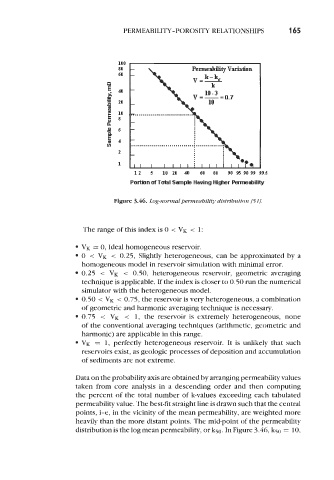
Figure 3.46. Log-normal permeability distribution [5I].
The range of this index is 0 < VK < 1:
VK = 0, Ideal homogeneous reservoir.
0 < VK < 0.25, Slightly heterogeneous, can be approximated by a
homogeneous model in reservoir simulation with minimal error.
0.25 < VK < 0.50, heterogeneous reservoir, geometric averaging
technique is applicable. If the index is closer to 0.50 run the numerical
simulator with the heterogeneous model.
0.50 -= VK -= 0.75, the reservoir is very heterogeneous, a combination
of geometric and harmonic averaging technique is necessary.
0.75 -= VK < 1, the reservoir is extremely heterogeneous, none
of the conventional averaging techniques (arithmetic, geometric and
harmonic) are applicable in this range.
VK = 1, perfectly heterogeneous reservoir. It is unlikely that such
reservoirs exist, as geologic processes of deposition and accumulation
of sediments are not extreme.
Data on the probability axis are obtained by arranging permeability values
taken from core analysis in a descending order and then computing
the percent of the total number of k-values exceeding each tabulated
permeability value. The best-fit straight line is drawn such that the central
points, i-e, in the vicinity of the mean permeability, are weighted more
heavily than the more distant points. The mid-point of the permeability
distribution is the log mean permeability, or k50. In Figure 3.46, k50 = 10,