
Page 318 - Phase Space Optics Fundamentals and Applications
P. 318
Self-Imaging in Phase Space 299
n n
1 C C¢
2d
1
2d¢
d
lR
x d¢ x
d
(a) (b)
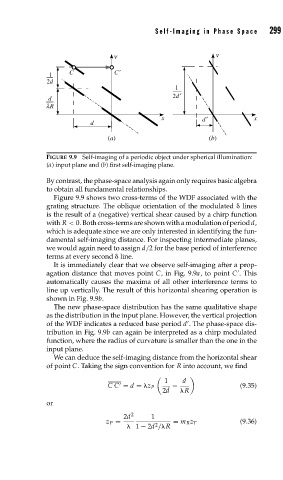
FIGURE 9.9 Self-imaging of a periodic object under spherical illumination:
(a) input plane and (b) first self-imaging plane.
By contrast, the phase-space analysis again only requires basic algebra
to obtain all fundamental relationships.
Figure 9.9 shows two cross-terms of the WDF associated with the
grating structure. The oblique orientation of the modulated lines
is the result of a (negative) vertical shear caused by a chirp function
with R < 0. Both cross-terms are shown with a modulation of period d,
which is adequate since we are only interested in identifying the fun-
damental self-imaging distance. For inspecting intermediate planes,
we would again need to assign d/2 for the base period of interference
terms at every second line.
It is immediately clear that we observe self-imaging after a prop-
agation distance that moves point C, in Fig. 9.9a, to point C . This
automatically causes the maxima of all other interference terms to
line up vertically. The result of this horizontal shearing operation is
shown in Fig. 9.9b.
The new phase-space distribution has the same qualitative shape
as the distribution in the input plane. However, the vertical projection
of the WDF indicates a reduced base period d . The phase-space dis-
tribution in Fig. 9.9b can again be interpreted as a chirp modulated
function, where the radius of curvature is smaller than the one in the
input plane.
We can deduce the self-imaging distance from the horizontal shear
of point C. Taking the sign convention for R into account, we find
1 d
CC = d = z P − (9.35)
2d R
or
2d 2 1
z P = 2 = m R z T (9.36)
1 − 2d / R