
Page 323 - Phase Space Optics Fundamentals and Applications
P. 323
304 Chapter Nine
n
S
P
1
d
P¢ x
d
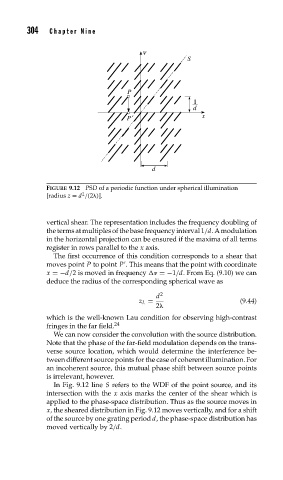
FIGURE 9.12 PSD of a periodic function under spherical illumination
2
[radius z = d /(2 )].
vertical shear. The representation includes the frequency doubling of
thetermsatmultiplesofthebasefrequencyinterval1/d.Amodulation
in the horizontal projection can be ensured if the maxima of all terms
register in rows parallel to the x axis.
The first occurrence of this condition corresponds to a shear that
moves point P to point P . This means that the point with coordinate
x =−d/2 is moved in frequency =−1/d. From Eq. (9.10) we can
deduce the radius of the corresponding spherical wave as
d 2
z L = (9.44)
2
which is the well-known Lau condition for observing high-contrast
fringes in the far field. 24
We can now consider the convolution with the source distribution.
Note that the phase of the far-field modulation depends on the trans-
verse source location, which would determine the interference be-
tween different source points for the case of coherent illumination. For
an incoherent source, this mutual phase shift between source points
is irrelevant, however.
In Fig. 9.12 line S refers to the WDF of the point source, and its
intersection with the x axis marks the center of the shear which is
applied to the phase-space distribution. Thus as the source moves in
x, the sheared distribution in Fig. 9.12 moves vertically, and for a shift
of the source by one grating period d, the phase-space distribution has
moved vertically by 2/d.