
Page 335 - Phase Space Optics Fundamentals and Applications
P. 335
316 Chapter Ten
signal’s WDF. In Fig. 10.1d we illustrate the PSD of the Fresnel trans-
formed signal. In Fig. 10.1e we show the PSD of a chirp modulated
signal. This is what happens when the signal passes through an ideal
thin lens. Multiplication by the chirp causes a vertical shearing of the
WDF. All these linear transformations that effect some change on the
WDF are special cases of the LCT. They all have matrices associated
with them that map each x-k coordinate on the WDF (and PSD) to a
new position. This coordinate shift is defined in Eqs. (10.8) and (10.9).
It is very important to note that all these mappings are affine; the
shaded area inside the PSD is conserved under the mapping. In Fig.
10.1f we show the PSD after the signal has been transformed by an
arbitrary LCT. We also note that in the case of the x-k bounded signal
shown in Fig. 10.1b the area of the PSD is exactly equal to the number
of samples required to represent the signal in the Nyquist limit. In the
next section we describe some more properties of the WDF and PSD
that are used in later sections.
10.2.4 Harmonics and Chirps
and Convolutions
The WDF of a harmonic function exp(+ j2 k 0 x), which in optics
represents a plane wave with wavelength traveling at an angle
−1
= sin ( k 0 ), has a WDF given by (k − k 0 ), where represents
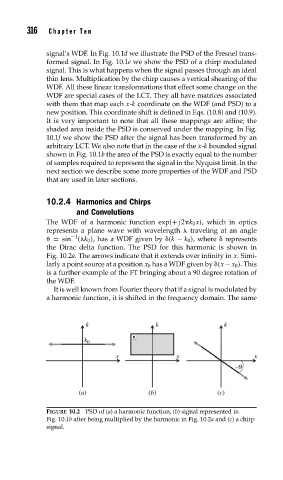
the Dirac delta function. The PSD for this harmonic is shown in
Fig. 10.2a. The arrows indicate that it extends over infinity in x. Simi-
larly a point source at a position x 0 has a WDF given by (x − x 0 ). This
is a further example of the FT bringing about a 90 degree rotation of
the WDF.
It is well known from Fourier theory that if a signal is modulated by
a harmonic function, it is shifted in the frequency domain. The same
k k k
k 0
x x x
–q
(a) (b) (c)
FIGURE 10.2 PSD of (a) a harmonic function, (b) signal represented in
Fig. 10.1b after being multiplied by the harmonic in Fig. 10.2a and (c) a chirp
signal.