
Page 154 - Phase-Locked Loops Design, Simulation, and Applications
P. 154
PLL PERFORMANCE IN THE PRESENCE OF NOISE Ronald E. Best 96
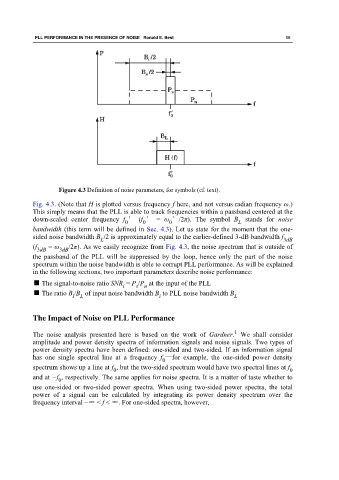
Figure 4.3 Definition of noise parameters, for symbols (cf. text).
Fig. 4.3. (Note that H is plotted versus frequency f here, and not versus radian frequency ω.)
This simply means that the PLL is able to track frequencies within a passband centered at the
down-scaled center frequency f ′ (f ′ = ω ′/2π). The symbol B stands for noise
0 0 0 L
bandwidth (this term will be defined in Sec. 4.3). Let us state for the moment that the one-
sided noise bandwidth B /2 is approximately equal to the earlier-defined 3-dB bandwidth f 3dB
L
(f = ω /2π). As we easily recognize from Fig. 4.3, the noise spectrum that is outside of
3dB 3dB
the passband of the PLL will be suppressed by the loop, hence only the part of the noise
spectrum within the noise bandwidth is able to corrupt PLL performance. As will be explained
in the following sections, two important parameters describe noise performance:
■ The signal-to-noise ratio SNR = P /P at the input of the PLL
i s n
■ The ratio B /B of input noise bandwidth B to PLL noise bandwidth B
i L i L
The Impact of Noise on PLL Performance
1
The noise analysis presented here is based on the work of Gardner. We shall consider
amplitude and power density spectra of information signals and noise signals. Two types of
power density spectra have been defined: one-sided and two-sided. If an information signal
has one single spectral line at a frequency f —for example, the one-sided power density
0
spectrum shows up a line at f , but the two-sided spectrum would have two spectral lines at f
0
0
and at −f , respectively. The same applies for noise spectra. It is a matter of taste whether to
0
use one-sided or two-sided power spectra. When using two-sided power spectra, the total
power of a signal can be calculated by integrating its power density spectrum over the
frequency interval −∞ < f < ∞. For one-sided spectra, however,