
Page 79 - Photoreactive Organic Thin Films
P. 79
58 TAKAYOSHI KOBAYASHIANDTAKASHI SAITO
These are slightly broader than 4.7fs, the FWHM of the pulse just at the out-
put of the NOPA. This is due mainly to the smearing effect induced by the
finite angle of pump and probe pulses (2.5 degrees) and the higher-order
chirp caused by cell-wall glasses or the thin beam splitter that separates pump
and probe beams.
The transient transmittance changes (AT/T (t)) of DMAAB/DMSO at
570 nm (n-n* breaching is dominant) induced by the pump pulse were meas-
ured up to l.Sps at the three previously mentioned chirp rates. They show
very complicated but clear oscillating features in all cases. The positive
transmittance change, averaged over the several oscillation periods due to the
ground-state bleaching, does not decay in the measured delay-time range
because of the decay of the excited state followed by the ground-state ther-
33
malization, which takes place for about 50ps. The average transmittance
change over the 50-1800 fs decay-time range is nearly proportional to the
pump-pulse energy, guaranteeing negligible contribution of nonlinear
photoexcitation, such as two-photon absorption.
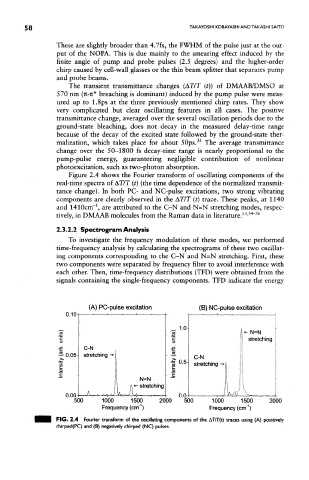
Figure 2.4 shows the Fourier transform of oscillating components of the
real-time spectra of AT/T (t) (the time dependence of the normalized transmit-
tance change). In both PC- and NC-pulse excitations, two strong vibrating
components are clearly observed in the AT/T (t) trace. These peaks, at 1140
1
and 1410cm" , are attributed to the C-N and N=N stretching modes, respec-
13 34 36
tively, in DMAAB molecules from the Raman data in literature. ' '"
2.3.2.2 Spectrogram Analysis
To investigate the frequency modulation of these modes, we performed
time-frequency analysis by calculating the spectrograms of these two oscillat-
ing components corresponding to the C-N and N=N stretching. First, these
two components were separated by frequency filter to avoid interference with
each other. Then, time-frequency distributions (TFD) were obtained from the
signals containing the single-frequency components. TFD indicate the energy
(A) PC-pulse excitation (B) NC-pulse excitation
0.10-j- — — ' — __ U __. — . — , __i — __ 1 . 1
1.0- !-
~£ 3 *- IN=N
"E c stretching
3
€ C-N 4
•3. 0.05- stretching -> 3-
*•>•«. C-N
"to f 0-5- stretching -» i
£ Ji ]
"c _c I
N=N 1 i t
(\ «- stretching / I i
i
VV-/1/
0.00- ^ >0\ _ T - 0.0 J A A \ V_ ..
500 1000 1500 2000 500 1000 1500 2000
1
1
Frequency (cm" ) Frequency (cm" )
FIG. 2.4 Fourier transform of the oscillating components of the AT/T(t) traces using (A) positively
chirped(PC) and (B) negatively chirped (NC) pulses.