
Page 81 - Photoreactive Organic Thin Films
P. 81
TAKAYOSHI KOBAYASH) AND TAKASHI SAITO
the Lissajou figures of the modulation frequencies. This difference demon-
strates that signals of PC- and NC-puise excitations correspond to different
28 30
electronic states—the excited state and the ground state, respectively. " It is
also well known that the excited-state wave packet is much more efficiently
28 29
generated when the ratio of the vibration period and pulse width is large. '
The modulation period of 400fs in Figure 2.5A is considered to corre-
spond to the oscillation between structures (B) and (C) as shown in Figure
3 37
2.2. ' In this model, C-N and N=N stretching modes are coupled as shown
in Figure 2.2B and C through a -N=N-4> torsion mode, and frequencies of
these two vibration modes are modulated by this torsion motion, with a
vibration period of about 400fs. These molecular vibrations and their
torsion-caused modulations are considered to be related to a doorway to the
chemical reaction. During a few vibrations of the torsion mode, the isonier-
ization reaction takes place with a stochastic probability, resulting in the
26
macroscopic reaction time constant of about Ips. The microscopic speed
of the configurational change associated with isomerization is fast enough
that the N=N and C-N stretching frequencies are not detected to have
the extremely modified frequencies of N-N and C=N stretching, respectively.
The torsion mode is thus probed by the changes in the N=N and C-N
stretching frequencies, even though these do not experience complete quan-
tum mechanical resonance configurations as N-N and C=N do. These fre-
quencies, including intermediate bond orders between 1 and 2 of each bond,
are averaged over the torsion time; hence they do not have bond orders that
are completely reversed from those of the ground state. It may be better to
say that the torsion time is too short to define the bond orders and correspon-
ding stretching frequencies for continuously changing configurations during
the torsion motion.
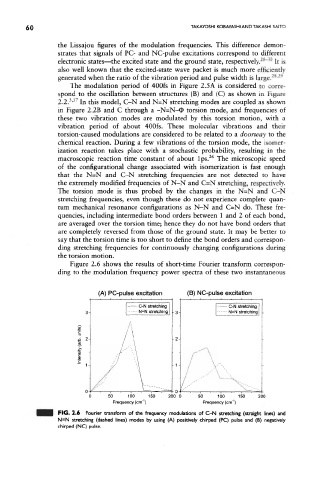
Figure 2.6 shows the results of short-time Fourier transform correspon-
ding to the modulation frequency power spectra of these two instantaneous
(A) PC-pulse excitation (B) NC-pulse excitation
50 100 150 200 0 50 100 150 200
1
1
Frequency (cm" ) Frequency (cm" )
FIG. 2.6 Fourier transform of the frequency modulations of C-N stretching (straight lines) and
N=N stretching (dashed lines) modes by using (A) positively chirped (PC) pulse and (B) negatively
chirped (NC) pulse.