
Page 80 - Photoreactive Organic Thin Films
P. 80
ULTRAFAST DYNAMICS IN THE EXCITED STATES OF AZO COMPOUNDS § f
content of a signal as a function of both time and frequency. There are many
methods of constituting TFD.
In this paper, we utilized the method of short-time Fourier transform
(spectrogram). The time-frequency (t-w) distributions P(t, w) of the time-
dependent signal s(t) is given as follows:
im
P(t,a)) = \\e~ s(r)h(r- t) drl 2 (2,1)
where h(t) is the time window function given by
b(t) = \ cos(27rt/T) (2,2)
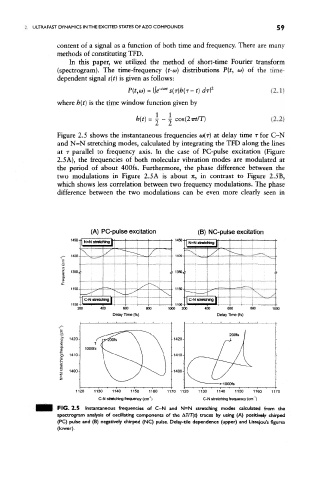
Figure 2.5 shows the instantaneous frequencies a>(r) at delay time r for C-N
and N=N stretching modes, calculated by integrating the TFD along the lines
at T parallel to frequency axis. In the case of PC-pulse excitation (Figure
2.5A), the frequencies of both molecular vibration modes are modulated at
the period of about 400fs. Furthermore, the phase difference between the
two modulations in Figure 2.5A is about rc, in contrast to Figure 2.5B,
which shows less correlation between two frequency modulations. The phase
difference between the two modulations can be even more clearly seen in
(A) PC-pulse excitation (B) NC-pulse excitation
400 600 800 400 600 800
Delay Time (fs) Delay Time (fs)
200fs
1420- 1420
-1400-
1000fe
1120 1130 1140 1150 1160 1130 1140 1150 1160
1
C-N stretching frequency (cm" ) C-N stretching frequency (cm"')
FIG. 2.5 Instantaneous frequencies of C-N and N=N stretching modes calculated from the
spectrogram analysis of oscillating components of the AT/T(t) traces by using (A) positively chirped
(PC) pulse and (B) negatively chirped (NC) pulse. Delay-tile dependence (upper) and Lissajou's figures
(lower).