
Page 200 - Physical Principles of Sedimentary Basin Analysis
P. 200
182 Heat flow
or (2) a constant temperature at the base of the lithosphere. These two alternative boundary
conditions give two different solutions that overlap for reasonable assumptions about a
sedimentary basin. The first case, of constant thermal gradient at infinite depth, gives the
temperature
A z + vt
T (z, t) = T 0 + A(z + vt) − (z + vt) erfc √
2 2 κt
A
vz z − vt
+ (z − vt) exp − erfc √ (6.299)
2 κ 2 κt
where T 0 is the surface temperature and A is the thermal gradient. This solution is not
straightforward to obtain and the reader is referred to Section 15.2 in Carslaw and Jaeger
(1959). It was obtained by Benfield (1949) in a study of thermal transients due to erosion.
Erosion gives the opposite effect of deposition – sediments are brought up towards the
surface faster than they are able to cool and reach a thermal steady state. We notice that
the temperature (6.299) is proportional to the gradient A when the surface temperature is
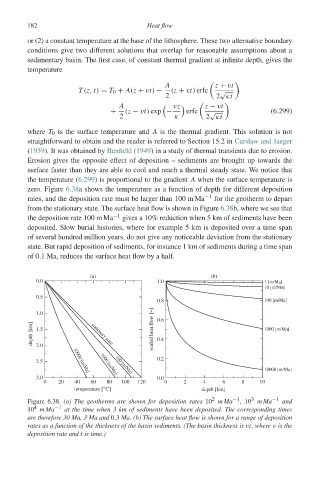
zero. Figure 6.38a shows the temperature as a function of depth for different deposition
rates, and the deposition rate must be larger than 100 m Ma −1 for the geotherm to depart
from the stationary state. The surface heat flow is shown in Figure 6.38b, where we see that
the deposition rate 100 m Ma −1 gives a 10% reduction when 5 km of sediments have been
deposited. Slow burial histories, where for example 5 km is deposited over a time span
of several hundred million years, do not give any noticeable deviation from the stationary
state. But rapid deposition of sediments, for instance 1 km of sediments during a time span
of 0.1 Ma, reduces the surface heat flow by a half.
(a) (b)
0.0 1.0 1 [m/Ma]
10 [m/Ma]
0.5
0.8 100 [m/Ma]
1.0 0.6
depth [km] 1.5 stationary state scaled heat flow [−] 0.4 1000 [m/Ma]
2.0
0.2
2.5 10000 [m/Ma] 1000 [m/Ma] 100 [m/Ma]
10000 [m/Ma]
3.0 0.0
0 20 40 60 80 100 120 0 2 4 6 8 10
temperature [°C] depth [km]
2
3
Figure 6.38. (a) The geotherms are shown for deposition rates 10 mMa −1 , 10 mMa −1 and
4
10 mMa −1 at the time when 3 km of sediments have been deposited. The corresponding times
are therefore 30 Ma, 3 Ma and 0.3 Ma. (b) The surface heat flow is shown for a range of deposition
rates as a function of the thickness of the basin sediments. (The basin thickness is vt, where v is the
deposition rate and t is time.)