
Page 223 - Physical Principles of Sedimentary Basin Analysis
P. 223
7.5 The McKenzie model of basin subsidence 205
make the subsidence negative, which means uplift. It follows from equation (7.28) that the
condition for subsidence (s > 0) is
c 1 c 1
m,0 − c,0 1 − α T a > m,0 α T a (7.29)
a 2 a 2
which gives
c 1 m,0
> α T a . (7.30)
a 2 ( m,0 − c,0 )
1
(The factor 1− α T a which is typically 0.97 has been approximated by 1.) Crustal thinning
2
implies subsidence, while thermal expansion is the cause for uplift, and condition (7.30)
states when the crust is sufficiently thick for subsidence from crustal thinning to be stronger
than thermal uplift. We get from inequality (7.30) that the condition for subsidence is
c/a > 0.13, when the densities for the crust and the mantle are c = 2800 kg m −3 and
m = 3300 kg m −3 , respectively, thermal expansibility is α = 3·10 −5 K −1 and the temper-
ature at the base of the lithosphere is T a = 1300 C. A typical thickness of the lithosphere is
◦
120 km, which makes the minimum thickness of the continental crust 15 km for subsidence
to take place. If the continental crust is less thick than ∼15 km it becomes temporarily ther-
mally uplifted. The average thickness of the continental crust is 35 km, which is sufficiently
thick for crustal thinning to imply subsidence.
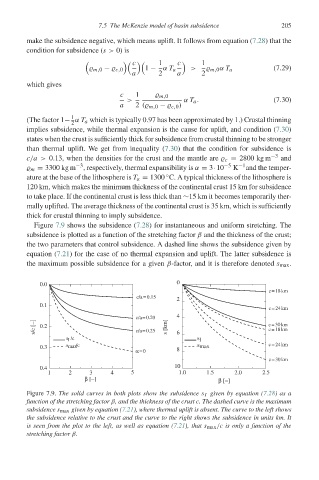
Figure 7.9 shows the subsidence (7.28) for instantaneous and uniform stretching. The
subsidence is plotted as a function of the stretching factor β and the thickness of the crust;
the two parameters that control subsidence. A dashed line shows the subsidence given by
equation (7.21) for the case of no thermal expansion and uplift. The latter subsidence is
the maximum possible subsidence for a given β-factor, and it is therefore denoted s max .
0.0 0
c = 18 km
c/a = 0.15
2
0.1
c = 24 km
c/a = 0.20 4
s/c [−] 0.2 c/a = 0.25 s [km] c = 30 km
c = 18 km
s /c 6 s I
I
s /c s max c = 24 km
0.3 max
α = 0 8
c = 30 km
0.4 10
1 2 3 4 5 1.0 1.5 2.0 2.5
β [−] β [−]
Figure 7.9. The solid curves in both plots show the subsidence s I given by equation (7.28)asa
function of the stretching factor β, and the thickness of the crust c. The dashed curve is the maximum
subsidence s max given by equation (7.21), where thermal uplift is absent. The curve to the left shows
the subsidence relative to the crust and the curve to the right shows the subsidence in units km. It
is seen from the plot to the left, as well as equation (7.21), that s max /c is only a function of the
stretching factor β.