
Page 243 - Physical Principles of Sedimentary Basin Analysis
P. 243
7.11 Lithospheric extension, phase changes and subsidence/uplift 225
mantle. The change in the average mantle density after instantaneous stretching with a
factor β is
1
1
m =− m,0 α T a 1 − (7.108)
2 β
and it becomes m =−32 kg m −3 for β = 2, using the parameters m,0 = 3300 kg m −3 ,
α = 3 · 10 −5 kg m −3 and T a = 1300 C. The associated thermal uplift becomes
◦
s = 1670 m. (See equation (7.33).) A change in the average mantle density gives much
more uplift or subsidence than in the crust because the lithospheric mantle is an order of
magnitude thicker than the crust.
It turns out that phase changes might take place in the lithospheric mantle when hot
mantle moves upwards during extension. There is a change in density when a material
enters a new phase. Phase changes in the mantle are dependent on the composition, and
we will in the following look at just one possible phase transition – the spinel–peridotite to
plagioclase–peridotite transformation. Kaus et al. (2005) shows that the spinel–plagioclase
transformation is the most important one during lithospheric extension because it gives the
largest density difference.
The example with thermal uplift shows that a moderate alteration of the average man-
tle density leads to a sizable vertical movement. The possible additional subsidence/uplift
from a phase change in the mantle during extension is now studied with a simple model
based on a study of Simon and Podladchikov (2008). Podladchikov et al. (1994) and
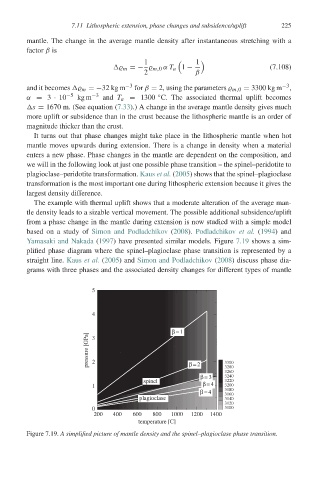
Yamasaki and Nakada (1997) have presented similar models. Figure 7.19 shows a sim-
plified phase diagram where the spinel–plagioclase phase transition is represented by a
straight line. Kaus et al. (2005) and Simon and Podladchikov (2008) discuss phase dia-
grams with three phases and the associated density changes for different types of mantle
5
4
β = 1
pressure [GPa]
3
2
β = 2
3300
3280
3260
β = 3 3240
spinel 3220
1 β = 4 3200
β = 4 3180
3160
plagioclase 3140
3120
0 3100
200 400 600 800 1000 1200 1400
temperature [C]
Figure 7.19. A simplified picture of mantle density and the spinel–plagioclase phase transition.