
Page 286 - Physical Principles of Sedimentary Basin Analysis
P. 286
268 Rheology: fracture and flow
Note 8.4 To arrive at expression (8.15)for x(t 1 ) it is beneficial to rewrite x(t) using the
trigonometric relationships
2tan 1 λt 1 − tan 2 1 λt
2 2
sin(λt) =
and cos(λt) =
. (8.24)
1 + tan 2 1 λt 1 + tan 2 1 λt
2 2
1
The next step is to replace λt 1 with − tan −1 (λ(x s − x d )/v), and the x 1 -position (8.15)
2
follows after a little algebra.
8.5 Fracture
There is a maximum stress a rock (or any other material) can support before it fails. Much
of what is known about the limits of the brittle strength of rocks is found from triaxial
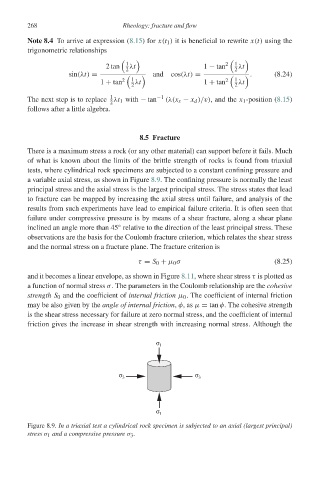
tests, where cylindrical rock specimens are subjected to a constant confining pressure and
a variable axial stress, as shown in Figure 8.9. The confining pressure is normally the least
principal stress and the axial stress is the largest principal stress. The stress states that lead
to fracture can be mapped by increasing the axial stress until failure, and analysis of the
results from such experiments have lead to empirical failure criteria. It is often seen that
failure under compressive pressure is by means of a shear fracture, along a shear plane
◦
inclined an angle more than 45 relative to the direction of the least principal stress. These
observations are the basis for the Coulomb fracture criterion, which relates the shear stress
and the normal stress on a fracture plane. The fracture criterion is
τ = S 0 + μ 0 σ (8.25)
and it becomes a linear envelope, as shown in Figure 8.11, where shear stress τ is plotted as
a function of normal stress σ. The parameters in the Coulomb relationship are the cohesive
strength S 0 and the coefficient of internal friction μ 0 . The coefficient of internal friction
maybealsogiven bythe angle of internal friction, φ,as μ = tan φ. The cohesive strength
is the shear stress necessary for failure at zero normal stress, and the coefficient of internal
friction gives the increase in shear strength with increasing normal stress. Although the
σ 1
σ 3 σ 3
σ 1
Figure 8.9. In a triaxial test a cylindrical rock specimen is subjected to an axial (largest principal)
stress σ 1 and a compressive pressure σ 3 .