
Page 50 - Physical Principles of Sedimentary Basin Analysis
P. 50
32 Properties of porous media
Table 2.2. A range of heat conductivities for sedimentary
rocks at 20 C(Blackwell and Steele, 1989).
◦
Heat conductivity
Lithology [W m −1 K −1 ]
Claystone and siltstone 0.80–1.25
Shale 1.05–1.45
Sand 1.70–2.50
Sandstone 2.50–4.20
2.5 100 0
heat conductivity [W/mK] 1.5 (1) depth [m] 200
2.0
1.0
(2) 300
0.5 400
0.0 0.2 0.4 0.6 0.8 1.0 1.5 2.0
porosity [−] heat conductivity [W/mK]
(a) (b)
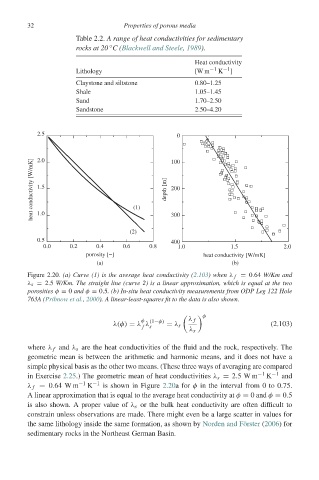
Figure 2.20. (a) Curve (1) is the average heat conductivity (2.103)when λ f = 0.64 W/Km and
λ s = 2.5 W/Km. The straight line (curve 2) is a linear approximation, which is equal at the two
porosities φ = 0 and φ = 0.5. (b) In-situ heat conductivity measurements from ODP Leg 122 Hole
763A (Pribnow et al., 2000). A linear-least-squares fit to the data is also shown.
φ
φ (1−φ) λ f
λ(φ) = λ λ = λ s (2.103)
f s
λ s
where λ f and λ s are the heat conductivities of the fluid and the rock, respectively. The
geometric mean is between the arithmetic and harmonic means, and it does not have a
simple physical basis as the other two means. (These three ways of averaging are compared
in Exercise 2.25.) The geometric mean of heat conductivities λ s = 2.5W m −1 K −1 and
λ f = 0.64 W m −1 K −1 is shown in Figure 2.20afor φ in the interval from 0 to 0.75.
A linear approximation that is equal to the average heat conductivity at φ = 0 and φ = 0.5
is also shown. A proper value of λ s or the bulk heat conductivity are often difficult to
constrain unless observations are made. There might even be a large scatter in values for
the same lithology inside the same formation, as shown by Norden and Förster (2006)for
sedimentary rocks in the Northeast German Basin.