
Page 51 - Physical Principles of Sedimentary Basin Analysis
P. 51
2.12 Fourier’s law and heat conductivity 33
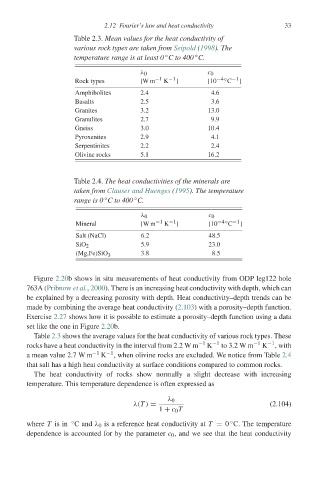
Table 2.3. Mean values for the heat conductivity of
various rock types are taken from Seipold (1998). The
◦
temperature range is at least 0 C to 400 C.
◦
λ 0 c 0
Rock types [W m −1 K −1 ] [10 −4◦ −1 ]
C
Amphibolites 2.4 4.6
Basalts 2.5 3.6
Granites 3.2 13.0
Granulites 2.7 9.9
Gneiss 3.0 10.4
Pyroxenites 2.9 4.1
Serpentinites 2.2 2.4
Olivine rocks 5.1 16.2
Table 2.4. The heat conductivities of the minerals are
taken from Clauser and Huenges (1995). The temperature
◦
range is 0 C to 400 C.
◦
λ 0 c 0
Mineral [W m −1 K −1 ] [10 −4◦ −1 ]
C
Salt (NaCl) 6.2 48.5
SiO 2 5.9 23.0
(Mg,Fe)SiO 3.8 8.5
3
Figure 2.20b shows in situ measurements of heat conductivity from ODP leg122 hole
763A (Pribnow et al., 2000). There is an increasing heat conductivity with depth, which can
be explained by a decreasing porosity with depth. Heat conductivity–depth trends can be
made by combining the average heat conductivity (2.103) with a porosity–depth function.
Exercise 2.27 shows how it is possible to estimate a porosity–depth function using a data
set like the one in Figure 2.20b.
Table 2.3 shows the average values for the heat conductivity of various rock types. These
rocks have a heat conductivity in the interval from 2.2 W m −1 K −1 to 3.2 W m −1 K −1 , with
a mean value 2.7 W m −1 K −1 , when olivine rocks are excluded. We notice from Table 2.4
that salt has a high heat conductivity at surface conditions compared to common rocks.
The heat conductivity of rocks show normally a slight decrease with increasing
temperature. This temperature dependence is often expressed as
λ 0
λ(T ) = (2.104)
1 + c 0 T
◦
◦
where T is in C and λ 0 is a reference heat conductivity at T = 0 C. The temperature
dependence is accounted for by the parameter c 0 , and we see that the heat conductivity