
Page 44 - Physical chemistry understanding our chemical world
P. 44
THE PRACTICE OF THERMODYNAMIC MEASUREMENT 11
water, Rey was not able to observe a linear dependence of l on T for his thermometer,
so he could not write l = aT + b (where a and b are constants).
For a more dense liquid, such as mercury, the relationship bet-
ween l and T is linear – at least over a relatively narrow range ‘Narrow’ in this case
of temperatures – so a viable mercury-in-glass thermometer may means 50–70 Cat
◦
be constructed. But, because the temperature response is only lin- most.
ear over a narrow range of temperatures, we need to exercise
caution.
If we assume the existence of a linear response for such a ther-
mometer, then the thermometer is ‘calibrated’ by correlating the To ‘calibrate’ an instru-
readings of length l using the known properties of the standard, as ment such as a ther-
follows. First, the thermometer is placed in a trough of pure ice at mometer, we correlate
its melting temperature, and the end of the mercury bead marked a physico-chemical
◦
as 0 C. The same thermometer is then placed in water at its boil- property (such as the
◦
ing point and the end of the mercury bead marked as 100 C. The length l of the mercury)
using the temperature-
physical distance between these two extremes is subdivided into
dependent properties
100 equal portions, each representing a temperature increment of of a known standard.
◦
1 C. This centigrade scale is satisfactory for most purposes. (The
same scale is sometimes called Celsius after a Swedish physicist
who championed its use.)
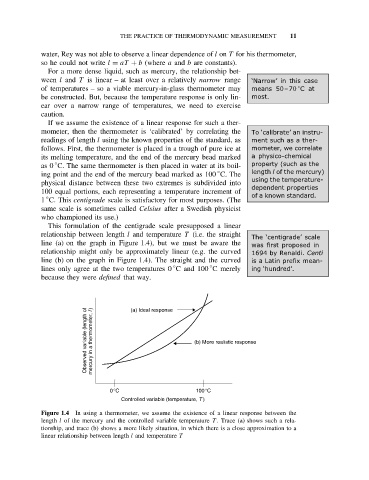
This formulation of the centigrade scale presupposed a linear
relationship between length l and temperature T (i.e. the straight
The ‘centigrade’ scale
line (a) on the graph in Figure 1.4), but we must be aware the was first proposed in
relationship might only be approximately linear (e.g. the curved 1694 by Renaldi. Centi
line (b) on the graph in Figure 1.4). The straight and the curved is a Latin prefix mean-
◦
◦
lines only agree at the two temperatures 0 C and 100 C merely ing ‘hundred’.
because they were defined that way.
Observed variable (length of mercury in a thermometer, l ) (a) Ideal response (b) More realistic response
0°C 100°C
Controlled variable (temperature, T )
Figure 1.4 In using a thermometer, we assume the existence of a linear response between the
length l of the mercury and the controlled variable temperature T . Trace (a) shows such a rela-
tionship, and trace (b) shows a more likely situation, in which there is a close approximation to a
linear relationship between length l and temperature T