
Page 57 - Physical chemistry understanding our chemical world
P. 57
24 INTRODUCTION TO PHYSICAL CHEMISTRY
an entire living room. To ensure the (small) can contains this (large)
Care:asmall p indi-
amount of gas, we pressurize it to increase its capacity. We see
cates pressure, yet a how volume and pressure are interrelated in a reciprocal way: the
big P is the symbol for
volume decreases as the pressure increases.
the element phospho-
rus. Similarly, a big V Robert Boyle was the first to formulate a relationship between
p and V . Boyle was a contemporary of the greatest scientist the
indicates volume and a
small v is the symbol world has ever seen, the 17th-century physicist Sir Isaac Newton.
for velocity. Boyle’s law was discovered in 1660, and states
pV = constant (1.9)
where the numerical value of the constant on the right-hand side of the equation
depends on both the identity and amount of the gas, as well as its temperature T .
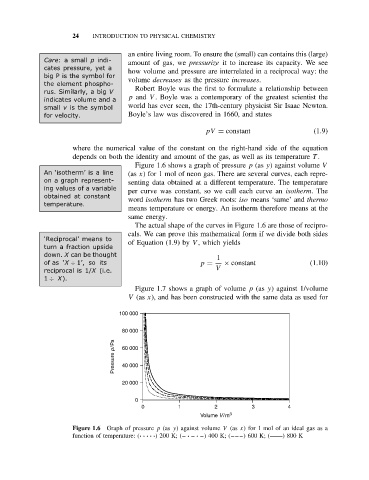
Figure 1.6 shows a graph of pressure p (as y) against volume V
An ‘isotherm’ is a line (as x) for 1 mol of neon gas. There are several curves, each repre-
on a graph represent- senting data obtained at a different temperature. The temperature
ing values of a variable
per curve was constant, so we call each curve an isotherm.The
obtained at constant word isotherm has two Greek roots: iso means ‘same’ and thermo
temperature.
means temperature or energy. An isotherm therefore means at the
same energy.
The actual shape of the curves in Figure 1.6 are those of recipro-
cals. We can prove this mathematical form if we divide both sides
‘Reciprocal’ means to of Equation (1.9) by V , which yields
turn a fraction upside
down. X can be thought 1
of as ‘X ÷ 1’, so its p = × constant (1.10)
reciprocal is 1/X (i.e. V
1 ÷ X).
Figure 1.7 shows a graph of volume p (as y) against 1/volume
V (as x), and has been constructed with the same data as used for
100 000
80 000
p/Pa 60 000
Pressure 40 000
20 000
0
0 1 2 3 4
Volume V/m 3
Figure 1.6 Graph of pressure p (as y) against volume V (as x) for 1 mol of an ideal gas as a
function of temperature: (·· ·· ·) 200 K; (– · – · –) 400 K; (– – –) 600 K; ( ) 800 K