
Page 58 - Physical chemistry understanding our chemical world
P. 58
PROPERTIES OF GASES AND THE GAS LAWS 25
7.00E+05
6.00E+05
800 K
5.00E+05
p/Pa 4.00E+05 600 K
Pressure 3.00E+05
2.00E+05 400 K
1.00E+05 200 K
0.00E+00
0 20 40 60 80 100
3
1/(V/m )
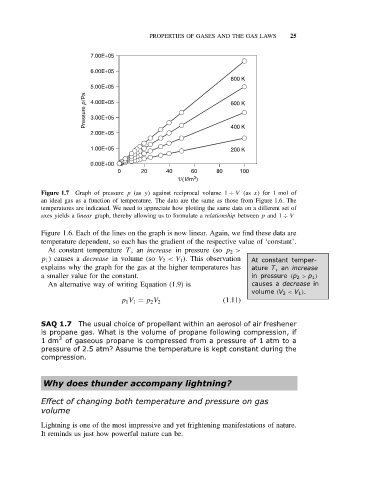
Figure 1.7 Graph of pressure p (as y) against reciprocal volume 1 ÷ V (as x) for 1 mol of
an ideal gas as a function of temperature. The data are the same as those from Figure 1.6. The
temperatures are indicated. We need to appreciate how plotting the same data on a different set of
axes yields a linear graph, thereby allowing us to formulate a relationship between p and 1 ÷ V
Figure 1.6. Each of the lines on the graph is now linear. Again, we find these data are
temperature dependent, so each has the gradient of the respective value of ‘constant’.
At constant temperature T ,an increase in pressure (so p 2 >
p 1 ) causes a decrease in volume (so V 2 <V 1 ). This observation At constant temper-
explains why the graph for the gas at the higher temperatures has ature T,an increase
a smaller value for the constant. in pressure (p 2 > p 1 )
An alternative way of writing Equation (1.9) is causes a decrease in
volume (V 2 < V 1 ).
p 1 V 1 = p 2 V 2 (1.11)
SAQ 1.7 The usual choice of propellant within an aerosol of air freshener
is propane gas. What is the volume of propane following compression, if
3
1dm of gaseous propane is compressed from a pressure of 1 atm to a
pressure of 2.5 atm? Assume the temperature is kept constant during the
compression.
Why does thunder accompany lightning?
Effect of changing both temperature and pressure on gas
volume
Lightning is one of the most impressive and yet frightening manifestations of nature.
It reminds us just how powerful nature can be.